Picture the month-end review you want: a 60% win rate, a clean list of trades, and the quiet sense that you are getting good at this. Now look at the same ten trades below the win rate. The account is down $400, and the setup you trust most is the one doing the damage.
A trading journal is a log of each trade you take, written so you can later measure whether your method pays. What to track in a trading journal comes down to that last clause: what you planned (stop, target, setup), what happened (entry, exit, fees) and any rule you broke. A journal that records only what happened feels productive and answers nothing.
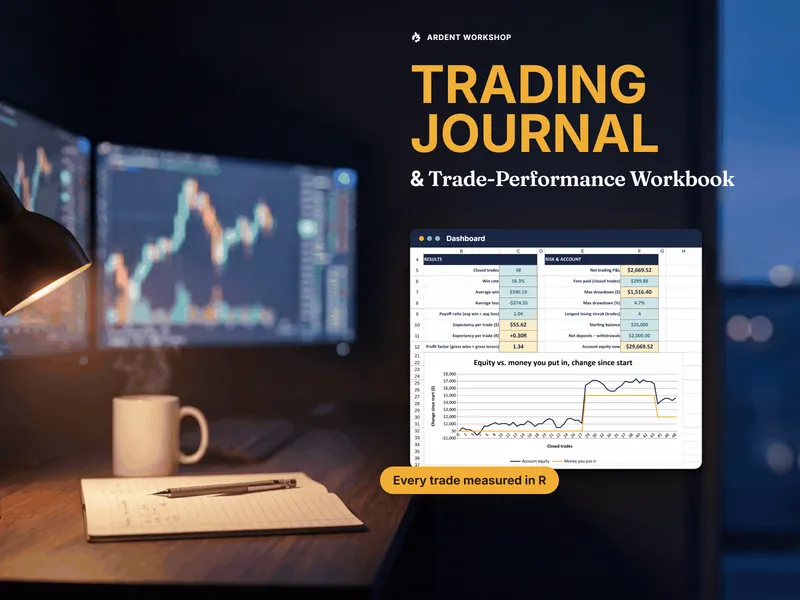
The fields below are the ones that change what you can see. You can keep them on paper or in a blank sheet. The arithmetic is where most journals quietly die, and it is what the Trading Journal & Trade-Performance Workbook does for you: log each trade once, and it works out the R-multiple on every trade, expectancy by setup and your account drawdown. To try the idea first, the free one-tab trade log calculates R on every row.
Here’s the hard truth, though: a journal does not create an edge. A working paper on the Brazilian equity futures market (opens in new tab) followed people who began day trading there between 2013 and 2015 and persisted for at least 300 days. 97% of them lost money, and the authors found no evidence of learning. That is one market and one style of trading, not a verdict on yours. But time at the screen did not rescue those traders, and a tidy log won’t do it by itself. What a journal can do is tell you the truth sooner, including the truth that a method isn’t paying.
What should a trading journal include?
A trading journal should include what you planned before the trade, what actually happened, and two labels that let you group trades later. Timing matters as much as the field itself: anything written after the exit is written by someone who already knows how the trade ended.
| Field | When to write it | What it lets you answer |
|---|---|---|
| Date and time in | At entry | Which hours and weekdays cost you |
| Symbol and asset class | At entry | Where your results concentrate |
| Side (long or short) | At entry | Whether one direction carries the other |
| Quantity and contract multiplier | At entry | How much size you really took |
| Entry price | At entry | The start of every later calculation |
| Planned stop | Before entry | What you agreed to lose |
| Target | Before entry | The reward-to-risk you planned |
| Setup tag | Before entry | Which kind of trade pays |
| Date and time out | At exit | How long you hold winners and losers |
| Exit price | At exit | The gross result |
| Fees | At exit | The net result, which is the real one |
| Mistake tag | At exit | What each broken rule costs |
From those you can calculate the rest, so never type them in by hand: net P&L, planned risk, R-multiple and hold time.
The four fields most trade logs skip
Four fields do most of the work, and they are the ones a date-symbol-profit spreadsheet leaves out.
- Planned stop. Without it there is no planned risk, and without planned risk there is no R-multiple, the net result divided by what you planned to risk. (More on what an R-multiple is.) Write it before you enter. A stop written afterward can be fitted to the outcome.
- Fees. On small trades they move the result noticeably, and a thin edge can disappear entirely once they are counted.
- Setup tag. Pick a short list of names for the kinds of trade you take and use only those. Twenty tags spread the same trades too thin to read. Six can be compared.
- Mistake tag. “Moved my stop”, “oversized”, “revenge trade”, “cut a winner early”. The last one is worth watching: a study of trading records for 10,000 accounts at a large discount brokerage (opens in new tab) found those investors had a strong preference for realizing winners rather than losers. Those were discount-brokerage investors, so treat it as a tendency to check your own log for, not a finding about your trading. A tag turns a habit you would never admit to into a number you can’t argue with.
Keep deposits and withdrawals on their own list, separate from trades. If they are mixed in, adding cash looks like a good month and taking some out looks like a bad one.
A worked trading journal: ten trades, two setups
Here is why the fields matter. The trades, setups and numbers below are invented for illustration. All net P&L figures are after fees.
| Trade | Setup | Planned risk | Net P&L | R-multiple | Mistake |
|---|---|---|---|---|---|
| 1 | Breakout | $200 | +$410 | +2.05R | None |
| 2 | Pullback | $100 | +$60 | +0.60R | None |
| 3 | Breakout | $200 | -$200 | -1.00R | None |
| 4 | Pullback | $400 | +$200 | +0.50R | None |
| 5 | Pullback | $100 | +$70 | +0.70R | None |
| 6 | Breakout | $200 | -$210 | -1.05R | None |
| 7 | Pullback | $400 | -$900 | -2.25R | Moved stop |
| 8 | Breakout | $100 | +$320 | +3.20R | None |
| 9 | Pullback | $100 | +$60 | +0.60R | None |
| 10 | Breakout | $200 | -$210 | -1.05R | None |
A log with only date, symbol and profit could tell you two things about this month: six wins out of ten, and a $400 loss. Here is what the other fields add.
| Setup | Win rate | Net P&L | Expectancy | Profit factor |
|---|---|---|---|---|
| Breakout | 40% | +$110 | +0.43R | 1.18 |
| Pullback | 80% | -$510 | +0.03R | 0.43 |
| All ten trades | 60% | -$400 | +0.23R | 0.74 |
Expectancy is what an average trade has returned, and profit factor is gross wins divided by gross losses. The guide to what trading expectancy is explains both in full. Read together, the rollup says four things a win rate never could.
- The setup that feels best is the weaker one. Pullback wins twice as often as Breakout and earns almost nothing per unit of risk. Its winners are small, around half to three-quarters of the risk taken.
- The setup that feels worst is paying. Breakout loses three times out of five. It is still ahead, because its two winners are far larger than its losers.
- One broken rule explains the month. Trade 7 planned to lose $400 and lost $900, because the stop moved. Had it held at -1R, the month would have ended about $100 up instead of $400 down. That single mistake tag is worth more than the rest of the log.
- Dollars and R disagree, and the reason is size. The month is negative in dollars and positive in R because the worst loss came on one of the two largest planned risks, $400, while the best trade of the month in R, +3.20R, was sized at $100. When the two measures point different ways, look at position size before you blame the setup.
Don’t change your trading on ten trades, though. They are an illustration of what the fields reveal, not evidence about breakouts or pullbacks. What a sample this small gives you is a question to keep logging toward.
What to leave out of a trading journal
Leave out anything you won’t group by or review, because every extra field makes the next entry a little more likely not to happen. A log that stops in week three measures nothing.
- A 1-to-10 confidence or mood score, at first. It feels insightful, but without a question to ask of it the number just sits there. Add it once the core fields have been habit for a few months, if you have a specific question it could answer.
- Paragraphs of market commentary. A sentence on why you took the trade is useful. If it runs longer, keep it in a separate notebook.
- Numbers you can calculate. Typing your own R-multiple invites typos and generous rounding.
- Only the trades you liked. This is the one omission that ruins everything else. Leave out your worst trades and every figure above stops being true.
If you want a written record of your reasoning, the same principle sits behind a decision journal: write it down before you know the outcome, because you can’t honestly reconstruct it afterward.
How to review a trading journal each month
Review a trading journal once a month, which is often enough to catch a broken rule and rarely enough that you are not reacting to a few trades. Twenty minutes and these five questions will do it:
- Which setup has the best expectancy in R, and on how many trades?
- Which mistake tag cost the most this month?
- Did any trade lose more than -1R, and why?
- Do R and dollars disagree anywhere? If so, what was the position size doing?
- What is the one rule you will change or keep next month?
Only ever take one rule forward. Five resolutions are a wish list, and next month’s log can’t tell you which of them worked.
Spreadsheet or app for a trading journal?
Choose by how often you trade. Journaling apps can import fills from your broker and replay trades, which earns its keep if you trade many times a day. A spreadsheet means typing each trade, and in exchange you get a file you own, formulas you can read and no brokerage login stored anywhere. The trading journal spreadsheet vs. journaling app comparison lays out who should pick which, including the case for running both.
Common Questions About Trading Journals
Can I start a trading journal with a blank spreadsheet?
Yes. A blank spreadsheet works for logging, and it is free. The work is in the rollups: keeping expectancy and profit factor correct by setup, and drawdown correct across the account, as the log grows.
How often should you review a trading journal?
Review a trading journal once a month, which is often enough to catch a broken rule and rarely enough that you are not reacting to a few trades.
How many trades do you need before a journal means anything?
More than feels comfortable. There is no fixed number, because it depends on how widely your results vary, but ten trades is not enough to judge a setup and five trades in one group is less.
Is a trading journal a tax record?
Not on its own. A trading journal measures your decisions, and your tax reporting should start from any form or statement your broker sent you. The 2025 IRS instructions for Form 8949 (opens in new tab) say to enter in column (d) the proceeds shown on the form or statement you received, and to make any needed correction as an adjustment in column (g). They also say to use your own records when your broker doesn’t know whether a gain or loss is short term or long term, so keep your trade confirmations as well, and ask a tax professional how this applies to you.
Start with the fields, then let the file do the math
The planned stop, the fees and the two tags cost you a few seconds a trade, and they are what separate a diary from a measurement. Start this week on whatever you have.
When the rollups get to be the part you dread, the Trading Journal & Trade-Performance Workbook was built for exactly this. Its Edge Finder ranks your setups and flags them as Mixed when R and dollars disagree, Mistake Cost puts a dollar figure on each tag, and the drawdown ignores your deposits. It is one purchase and a file you keep, in Excel or Google Sheets, with no broker connection and no subscription.