
The formula
R = net P&L ÷ planned risk. Net P&L is what the trade made or lost after fees. Planned risk is what you decided, before you entered, you were willing to lose: the distance from your entry to your planned stop, times the quantity (and times the contract multiplier for options and futures).
That one division turns a dollar result into a multiple of your own risk. A trade that makes twice what you risked is +2R. A trade that loses exactly what you planned is −1R. Nothing in the formula depends on how big the position was.
One trade, worked through
Take a fictional stock, ACME. You buy 125 shares at $48.20, with a planned stop at $46.20. You sell at $52.00 and pay $2.00 in fees.
- Planned risk: ($48.20 − $46.20) × 125 = $250
- Gross profit: ($52.00 − $48.20) × 125 = $475
- Net profit: $475 − $2.00 = $473
- R-multiple: $473 ÷ $250 = 1.89R
You made almost twice the amount you had put at risk. That sentence is more useful than "I made $473," because it still means something next month when you trade a different size in a different market.
What −1R and worse than −1R mean
A loss of exactly −1R is the plan working: you were wrong, the stop did its job, and you lost what you had agreed to lose. That is a normal cost of trading, not an error.
A loss worse than −1R is different. You lost more than you planned, and that is the signal a rule was broken, such as a stop that was moved or ignored. Scanning a journal for every trade below −1R shows you where that happened.
Why R makes trades comparable
Dollars depend on position size, so a $400 win on a large position and a $400 win on a small one look identical and are not. R removes the size. A 125-share stock trade and a one-contract futures trade can sit in the same list and be compared directly, because each is measured against the risk you took on that trade.
It also lets you add trades up honestly. Averaging R across many trades gives you your expectancy: what an average trade has returned, in units of risk.
What is a good R-multiple?
There is no universal good number. It depends on how often you win. A method that wins most of its trades can be profitable with small winners, while one that wins a third of the time can still pay if its winners are about three times the size of its losers. A single trade's R tells you how that trade went; whether your method pays comes from the average across many trades, which is trading expectancy.
Common mistakes with R
- Having no planned stop. Without a stop decided in advance there is no planned risk, and so no R. Write the stop down before you enter.
- Moving the stop after entry. If you widen it, you have changed the risk after the fact and the R you compute flatters you. Log the risk you planned at entry.
- Ignoring fees. R uses net P&L. On small trades, fees can move the multiple noticeably.
- Judging a setup on a handful of trades. Five trades is a start, not proof. A few good R results can be a lucky week.
Calculate R in a spreadsheet you own
The free Trading Journal & Trade Log is a one-tab trade log, pre-filled with sample trades, that computes net P&L, planned risk and R-multiple on every row, plus a running win rate. No signup wall, and the file is yours to keep.
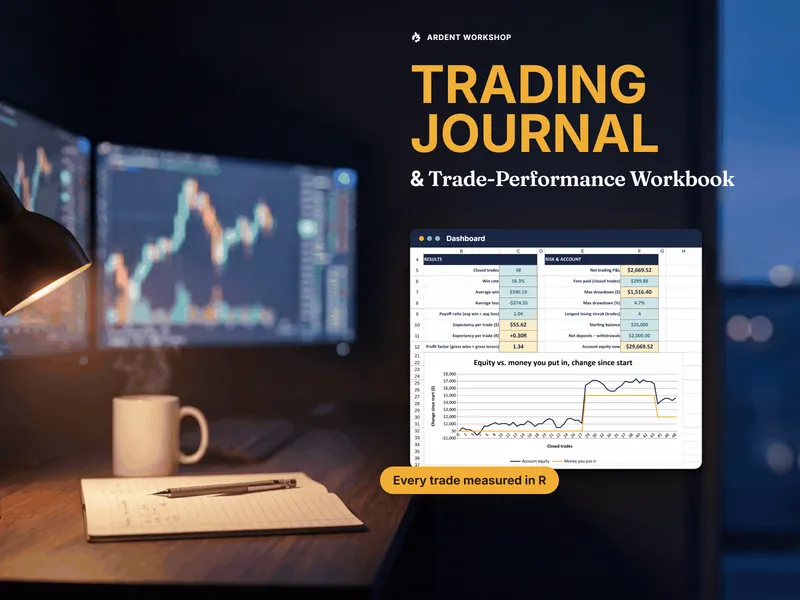
The Trading Journal & Trade-Performance Workbook goes further: it computes R-multiple, expectancy and profit factor by setup, symbol, weekday and side, the dollar cost of each mistake tag against your clean trades, and a drawdown tracked in the order trades closed. It covers stocks, options, futures, crypto and USD-quoted forex in one log. It is a one-time purchase, not a subscription.
Not advice: this page and these tools record and measure your own trades. They give no trade signals and are not investment or tax advice.
Related concepts
R is the building block for trading expectancy, and it pairs with profit margin as a way of asking whether the work pays once costs are counted. Choosing where to log it? See the trading journal spreadsheet vs. journaling app comparison.
Templates that implement this
Tools that calculate R for every trade
1 template
A trading journal workbook that works out planned risk and R-multiple for each trade you log, plus a free one-tab trade log to try the idea on your own trades.
Frequently asked questions
- How do you calculate an R-multiple?
- Divide the trade's net profit or loss (after fees) by the amount you planned to risk on it. Planned risk is the distance from your entry to your planned stop, times the quantity, times the contract multiplier for options or futures. A long of 125 shares bought at $48.20 with a stop at $46.20 risks $250; selling at $52.00 with $2.00 in fees nets $473, which is 473 ÷ 250 = 1.89R.
- What is a good R-multiple?
- There is no universal good number for a single trade. What matters is your average R across many trades, which is your expectancy in R, and that depends on how often you win as well as how big the wins are. A method that wins a third of the time can still pay if its winners are three times its losers.
- What does a loss worse than -1R mean?
- A loss of exactly -1R means you lost what you planned to lose. A loss bigger than that, such as -2.33R, means the trade lost more than your plan allowed: the stop was moved or skipped. It is the signal that a rule was broken.
- Can you calculate R without a stop-loss?
- No. R is measured against the risk you planned, and without a planned stop there is no planned risk to divide by. That is why a trading journal asks for the stop at entry, not after the trade closes.