Ask a room of safety leads whether the safety pyramid is true and you will get a fight. Half of them have it framed in the break room. The other half will tell you it is a 95-year-old myth that has quietly steered safety programs away from the accidents that kill people. Both sides are partly right, and the useful answer sits exactly where they disagree.
The Heinrich safety pyramid (also called Heinrich’s triangle or the accident triangle) is the claim that serious injuries sit on top of a much larger base of minor injuries and no-injury accidents, in a fixed ratio: for every 1 major injury, 29 minor injuries and 300 accidents that hurt no one. Herbert W. Heinrich published it in 1931 in Industrial Accident Prevention, and its practical promise is simple: shrink the base and the top shrinks with it.
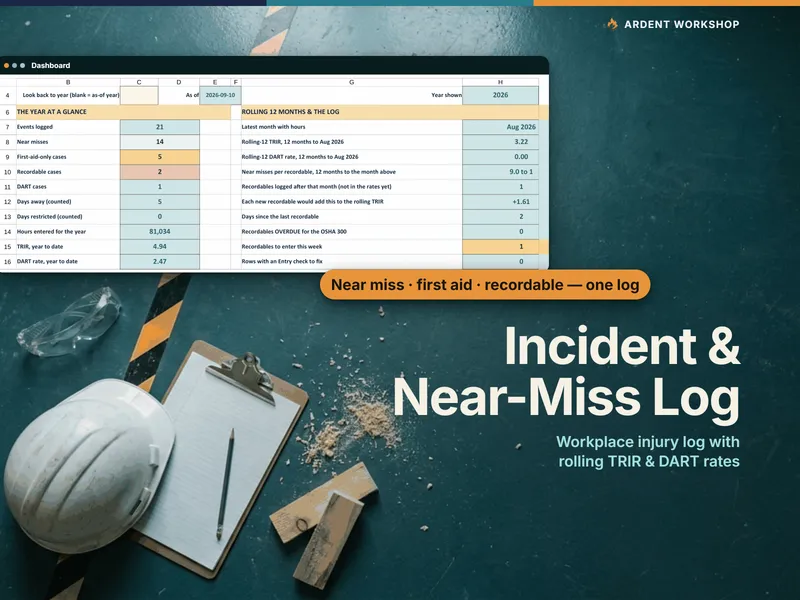
For most small crews the pyramid’s bottom layer is not a statistic at all. It is a close call that got a laugh, a “that was lucky,” and no record anywhere. If that is where you are, the fix is a place to write them down, with a way to tell a nothing-event from a fall that almost happened. The Workplace Incident, Near-Miss & Injury Log Workbook keeps near misses, first-aid cases and recordable injuries on one log, with each corrective action tied to the event it fixes. But whether you should trust the pyramid it is built around is a real question, so here is the argument from both sides.
What is the Heinrich safety pyramid?
The Heinrich safety pyramid is a three-tier model of workplace accidents in which each serious injury is preceded by 29 minor injuries and 300 no-injury accidents. Heinrich’s own words, from the first edition, as quoted in Fred Manuele’s 2011 review of Heinrich in Professional Safety (opens in new tab): “in a unit group of 330 accidents, 300 result in no injuries, 29 in minor injuries, and 1 in a major or lost-time case.”
The tiers mean something narrower than most people assume. Heinrich defined all three, and his definitions are the part of the pyramid that almost never makes it onto the poster:
| Tier | Count per 330 accidents | What Heinrich meant by it |
|---|---|---|
| Major injury | 1 | Any case reported to an insurance carrier or the state compensation commissioner |
| Minor injury | 29 | A scratch, bruise or laceration, “commonly termed a first-aid case” |
| No-injury accident | 300 | An unplanned event (a slip, a fall, a flying object) that could have caused injury or damage but did not |
That first row is the one to read twice. In Heinrich’s fourth-edition definition, quoted by Manuele, “a major injury is any case that is reported to insurance carriers or to the state compensation commissioner,” and “the great majority of reported or major injuries are not fatalities or fractures or dismemberments.” The top of Heinrich’s pyramid is not a death. It is roughly any injury that needed more than first aid.
The 300 at the base is what safety teams now call a near miss, an unplanned event that could have hurt someone and did not. (The site’s definition of a near miss covers the term on its own.)
Bird’s version: the 1-10-30-600 triangle
The pyramid most safety posters show today is actually Frank Bird’s. In 1969 Bird analyzed 1.75 million incident reports from 297 organizations in 21 industries. As a 2012 conference paper by Mike Williamsen in the ASSE proceedings (opens in new tab) summarizes the result, “for every serious or major accident, there were 10 minor injuries, 30 property damage events, and 600 no loss incidents.” Those 600 are what safety teams now call near misses. Bird’s version added a property-damage tier and was built from a far larger dataset whose size and scope were reported, which matters for the argument below.
The case for the safety pyramid
The strongest case for the pyramid is that its shape is real. Less severe events do outnumber more severe ones, in nearly every workplace anyone has measured, and that alone makes the bottom of the pyramid the cheapest place to learn.
- The shape holds up in modern data. A study of serious-injury precursors published in Professional Safety in 2015 by Donald Martin and Alison Black of BST (opens in new tab) states it plainly: “The Heinrich Triangle Is Accurate Descriptively.” Its data “confirmed that an inverse relationship exists between injury frequency and severity.”
- A large dataset gives it conditional support. Patrick Yorio and Susan Moore tested the triangle against U.S. Mine Safety and Health Administration records from 27,446 mining establishments active between 2000 and 2012 (opens in new tab). They found that more lower-severity incidents at an establishment were associated with a higher probability of a fatality over time, and that a triangle did appear, though its form depended on how severity was divided up.
- Near misses are free lessons. A near miss carries the same hazard as an injury without the injury. The regulator agrees: OSHA’s incident investigation guidance (opens in new tab) “strongly encourages employers to investigate all incidents in which a worker was hurt, as well as close calls (sometimes called ‘near misses’).”
- It gets people reporting. Whatever its flaws as math, the pyramid is a persuasive picture. It tells a crew that the close call they shrugged off belongs on the record, which is the behavior every safety program depends on.
On this side’s reading, the pyramid is a teaching tool, and a good one. Nobody needs the ratio to be exact for the lesson to land.
The case against the safety pyramid
The case against is that the pyramid’s numbers cannot be checked, its causal claim is wrong, and taken literally it points effort at the wrong accidents.
- The original data is gone. Safety+Health magazine’s review of Heinrich’s theories (opens in new tab) notes that “the original files Heinrich used do not exist, preventing others from reviewing his work.” Manuele goes further: the data behind Heinrich’s related claim that 88% of accidents are caused by “unsafe acts of persons” came from insurance claim files and plant owners’ records, “which cannot provide reliable accident causal data because they rarely include causal factors.”
- There is no constant ratio. The same 2015 BST study that confirmed the shape also found that “the ratio of less to more severe injuries varies among companies, and that no constant ratio exists.” A company that tells its crew “300 near misses means a serious injury is coming” is quoting a number that was never stable.
- Fewer small injuries has not meant proportionally fewer serious ones. Manuele, drawing on National Council on Compensation Insurance data, notes that workers’ compensation claim frequency fell sharply while the reduction for claims valued above $50,000 was “about one-fifth of that for the less costly and less serious injuries.” His conclusion: “a comparable reduction in injury severity does not follow a reduction in injury frequency.”
- It can hide the dangerous stuff behind good-looking numbers. A risk-engineering review of the pyramid (opens in new tab) quotes the 2007 Baker report on BP’s 2005 Texas City refinery explosion: “BP mistakenly interpreted improving personal injury rates as an indication of acceptable process safety performance at its US refineries.”
- It blames workers. Heinrich paired the pyramid with the 88% unsafe-acts figure, and critics argue the combination pushes programs toward correcting individual behavior rather than fixing the equipment, procedures and supervision that made the unsafe act easy.
On this side’s reading, the pyramid is not a harmless teaching tool. It tells managers that a falling injury rate means a safer site, and that is exactly the belief that lets the fatal exposure go unmanaged.
The real dividing line: SIF potential in near misses
Both sides are describing the same fact from different ends: near misses are not all the same size. A pulled muscle from lifting a box and a worker whose harness was not tied off when a plank shifted both land in the pyramid’s bottom layer. Only one of them was one step from a funeral.
That is what the 2015 BST research measured. Reviewing reported cases one by one, the team found that 21% of all reported cases had serious-injury-or-fatality (SIF) exposure, and the share of nonserious injuries with SIF exposure potential ranged from 10% to 36% between companies. The paper’s own example: “a back strain from lifting a load has little SIF exposure potential, while a fall from an elevated work position has high SIF exposure.” A program can drive down the first kind for years and never touch the second.
The same paper names what to look for. A SIF precursor is a high-risk situation where the controls are missing, not working or not being followed, and which will produce a serious injury or fatality if it is allowed to continue. It is the specific thing to look for in a near-miss log.
The stakes are not abstract in the trades. The BLS Census of Fatal Occupational Injuries (opens in new tab) recorded 5,070 fatal work injuries in the United States in 2024. Construction and extraction workers accounted for 1,032 of them, and 370 of those deaths were falls, slips and trips.
How to use the safety pyramid on a small crew
The verdict: keep the pyramid’s habit and drop its arithmetic. Log every near miss, because the base is where the cheap lessons are. Then stop treating the base as one pile, and sort it by what could have happened rather than by what did.
- Log every near miss, the same day. A close call that is not written down cannot be counted, sorted or fixed. One line is enough: date, where, what happened, what could have happened.
- Tag each one for serious-injury potential. Ask one question: if this had gone the other way, could someone have been killed or permanently hurt? Falls from height, struck-by, caught-in and electrical contact usually say yes. Strains, minor cuts and trip-on-flat-ground events usually say no.
- Close the high-potential ones first. Every near miss deserves a look. The ones tagged for SIF potential get a corrective action with an owner and a date, before anything else on the list.
- Read your own ratio as a reporting check, not a forecast. Near misses per recordable injury tells you whether people are reporting, not when the next injury will happen. A crew logging almost no near misses is not a safe crew. It is a crew that is not writing them down. The mechanics of that ratio are in the tutorial on how to calculate incident rate.
- Never let a falling injury rate close the conversation. A good TRIR year with an open high-potential near miss is not a good year. Report both numbers side by side.
- Talk about the high-potential ones out loud. A near miss that could have been fatal is the best toolbox talk you will get all month. For a year of ready-made subjects, see the post on toolbox talk topics.
A worked example with illustrative numbers
Here is how the sorting changes the picture. These numbers are invented to show the method, not drawn from any real company. Picture a 12-person framing crew’s year:
| Event type | Count | With SIF potential | Example |
|---|---|---|---|
| Near miss | 40 | 6 | Unclipped harness on a second-floor top plate |
| First-aid case | 9 | 1 | Nail-gun graze to the hand |
| Recordable injury | 1 | 0 | Back strain that needed physical therapy |
Read as a pyramid, that year looks healthy: one recordable, a strong reporting base, a textbook shape. Read by potential, the story changes. The one recordable injury had no fatal potential at all. The seven events that could have killed someone never produced a recordable, so a program that only watched its injury rate would never have seen them. Those seven are the year’s real safety agenda, and six of them are sitting in the near-miss log.
The SIF-potential tag is a judgment call, and no spreadsheet makes it for you. What falls apart by the second quarter is everything around it: the log, the rates and the open actions. The Workplace Incident, Near-Miss & Injury Log Workbook keeps the near misses beside the recordables (never mixed into them), tracks a near-miss-per-recordable figure next to rolling TRIR and DART rates, and flags any near miss or recordable that has no corrective action yet. And because a near miss can trace back to a skill, a certification or a briefing that was missing, the Crew Safety & Training-Compliance Kit connects toolbox talks, safety-training currency and skill levels, and shows which people are cleared to work at each station. It is one purchase and one set of files, not a subscription.
Common Questions About the Heinrich Safety Pyramid
Is Heinrich’s safety pyramid still valid?
Half of it is. The shape holds: minor events vastly outnumber serious ones in almost every workplace. The fixed 300-29-1 ratio does not hold, and the idea that cutting minor incidents proportionally cuts fatalities has been contradicted by claims data and by later research on serious injuries.
What is the difference between Heinrich’s triangle and Bird’s triangle?
Heinrich’s 1931 triangle has three tiers: 300 no-injury accidents, 29 minor injuries and 1 major injury. Frank Bird’s 1969 version has four: 600 no-loss incidents (near misses), 30 property-damage events, 10 minor injuries and 1 serious or major accident, and it was built from a far larger dataset of 1.75 million incident reports.
What is a SIF precursor?
A SIF precursor is a high-risk situation where the controls are missing, not working or not being followed, and which will produce a serious injury or fatality if it is allowed to continue. It is the specific thing to look for in a near-miss log.
Sources
- Manuele, “Reviewing Heinrich: Dislodging Two Myths From the Practice of Safety,” Professional Safety, October 2011 (opens in new tab)
- Martin and Black, “Preventing Serious Injuries & Fatalities: Study Reveals Precursors & Paradigms,” Professional Safety, September 2015 (opens in new tab)
- Williamsen, “Near-Miss Reporting: The Missing Link of Safety Culture Revolution,” ASSE conference proceedings, 2012 (opens in new tab)
- Yorio and Moore, “Examining Factors that Influence the Existence of Heinrich’s Safety Triangle Using Site-Specific H&S Data from More than 25,000 Establishments,” Risk Analysis (opens in new tab)
- Safety+Health magazine’s review of Heinrich’s theories (opens in new tab)
- Risk-engineering.org on the Heinrich/Bird accident pyramid (opens in new tab)
- OSHA incident investigation guidance (opens in new tab)
- BLS Census of Fatal Occupational Injuries, 2024 (opens in new tab)