Why the rate is arithmetic, not a gut feeling
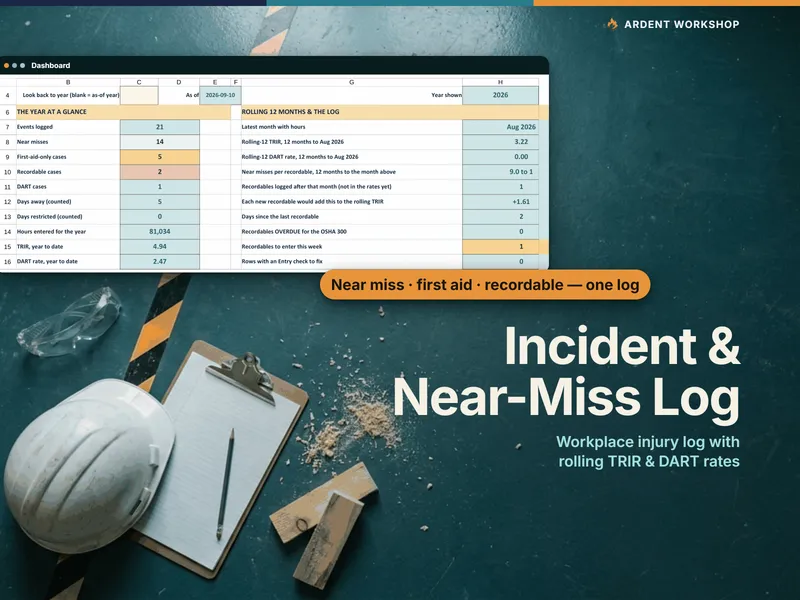
“Is our safety record getting better or worse?” is a real question, and answering it by feel means the answer changes with whoever’s asking and how recent the last incident was. TRIR and DART rate turn it into two numbers computed the same way every time, from the same two inputs: how many hours people worked, and how many recordable cases happened in that time. The Workplace Incident, Near-Miss & Injury Log Workbook runs this calculation from a monthly hours ledger so the rate updates itself instead of getting rebuilt from scratch each time someone asks — but the method underneath is the same seven steps whether you run it there or in a blank sheet.
Step 1 — Gather hours worked from payroll, monthly
The formula’s denominator is hours actually worked, not paid hours and not headcount — pull it from payroll or timekeeping for every employee covered by your 300 log during the period. Do this every month, as its own line item, so a full year is twelve numbers you already have on hand rather than a total you have to reconstruct under deadline.
Step 2 — Count recordable cases for the period
Count the cases that meet OSHA’s recordability criteria for that period — this tutorial doesn’t decide that for you; your recordkeeping program and the 1904 criteria do. Once a case is recordable, you have 7 calendar days from receiving the information to enter it on the 300 log and the 301 (§1904.29(b)(3) (opens in new tab)), so this count should already be current rather than assembled after the fact.
Step 3 — Count the DART cases inside that total
Inside your recordable count, tag the DART cases (days away from work, restricted duty, or job transfer). DART is a subset of recordable, never a separate count of new incidents. When you total the combined days away and restricted days for a case, you may cap that total at 180 calendar days; the cap is optional, and applying it or not is your call under §1904.7(b)(3)(vii) (opens in new tab).
Step 4 — Apply the formula
Both rates use the same shape: cases × 200,000 ÷ hours worked. TRIR uses every recordable case; DART rate uses only the cases you tagged in Step 3. The 200,000 isn’t arbitrary — it’s 100 full-time workers at 40 hours a week for 50 weeks a year, the standard base that lets a 12-person shop and a 1,200-person plant read on the same scale.
A worked year
The workbook’s fictional sample year runs one shop through a full 12 months. Here’s what the four numbers produce:
| Measure | Formula | 2025 numbers | Result |
|---|---|---|---|
| TRIR | recordable cases × 200,000 ÷ hours worked | 4 × 200,000 ÷ 121,759 | 6.57 |
| DART rate | DART cases × 200,000 ÷ hours worked | 2 × 200,000 ÷ 121,759 | 3.29 |
| Near-miss ratio | near misses ÷ recordable cases | 16 ÷ 4 | 4.0 near misses per recordable |
To check your own year the same way, the free TRIR Calculator & Near-Miss Report Pad takes a year’s recordable cases, DART cases, near misses and hours worked and returns TRIR, DART rate and the near-miss ratio in one tab.
Step 5 — Roll it to a trailing 12 months
Sum recordable cases and hours worked over the last 12 months, not the calendar year to date, and run the same division. A rolling-12 rate doesn’t drop back to zero every January 1st: it moves every month, by design, and a rough quarter stays in it for exactly 12 months before it drops out.
Step 6 — Add the near-miss ratio
A near miss — no injury or illness occurred — never goes on the OSHA 300 log, so it can’t move TRIR or DART rate. What it can do is give you something to watch between injuries: divide your near-miss count by your recordable count for the same period. If the ratio falls, either recordable cases rose, near misses genuinely dropped, or close calls have stopped being reported — check which. In a period with no recordable cases the ratio can’t be calculated, so watch the near-miss count on its own. The 2025 sample above ran 16 near misses against 4 recordables, a ratio of 4.0.
Step 7 — Repeat monthly, and freeze the calendar-year totals for the 300A
Recompute the rolling-12 rates and the near-miss ratio every month so the trend line stays current. Then, once the calendar year closes, freeze that year’s case totals and hours worked for the Form 300A summary — the 300A carries those totals, not a rate or a ratio. Post it February 1 through April 30 (§1904.32(b)(6) (opens in new tab)), have a company executive certify it (§1904.32(b)(3) (opens in new tab)), and keep the underlying records for 5 years after the year they cover (§1904.33 (opens in new tab)). Some establishments also submit the 300A electronically to OSHA — the thresholds and the March 2 due date are set in §1904.41 (opens in new tab), and they turn on your headcount and industry, not on this calculation.
Do it in a workbook you own
You can run all seven steps in a blank spreadsheet, updating the hours ledger and case counts by hand every month. Or start from one built for exactly this: the Workplace Incident, Near-Miss & Injury Log Workbook logs every near miss, first-aid case, and recordable injury, turns a monthly hours ledger into a rolling-12 TRIR and DART rate automatically, tracks the near-miss-to-recordable ratio, and produces 300A-ready year-end totals with a corrective action — and an overdue flag — linked to every event. Pair it with the Safety-Training & Toolbox-Talk Compliance Tracker for the training side of the record, or the Weekly Toolbox-Talk & Safety-Meeting Script Library for the talks that catch a hazard before it becomes a case. New to the terms? See what a near miss is and what TRIR measures, or start free with the TRIR Calculator & Near-Miss Report Pad.