Every manager has seen this spreadsheet. One column of names, one column of salaries.
$78,000. $71,000. $63,500. $61,000. $59,000. $51,500.
Now answer the question the spreadsheet exists to answer: which one of those is wrong?
You can’t. Not from that column, where the smallest number looks like the problem and the biggest looks fine. One of those six people is a support rep, one is an ops analyst, and one runs the office — three jobs the market prices completely differently. Comparing their salaries to each other is like pricing a bicycle against a sofa.
There is a single number that fixes this. It is called compa-ratio, and it is a person’s salary divided by the midpoint of the pay band for their role. One division — and once you have it, those six salaries sort themselves into an order that has almost nothing to do with their size.
It is a number most compensation teams use routinely and most managers are never shown. In that list, the underpaid person is not the one earning $51,500.
Compa-ratio is a salary divided by its band midpoint
Compa-ratio is a person’s salary divided by the midpoint of the pay band for their role. A compa-ratio of 1.00 means they are paid exactly the rate the band targets. 0.90 means ten percent below it. 1.10 means ten percent above.
That single division does something a raw salary can never do: it puts every person in the company on the same scale. A coordinator at 0.88 and a director at 0.88 are underpaid by the same amount relative to their own jobs, even though one earns three times the other. You can now sort an entire roster by a column that means the same thing in every row.
The rest of this post is the audit you run with it — how to get a midpoint when you do not have one, how to read what comes back, the five innocent explanations you must rule out before concluding anything, and what fixing it actually costs. (If you want the metric on its own — how it differs from range penetration, and how it feeds formal pay-equity work — that lives in the glossary entry on what compa-ratio is.)
The arithmetic is trivial. The reason most teams have never done it is that assembling the inputs — every salary next to a defensible midpoint for its role — is a tedious afternoon of lookups, and the moment you finish, the numbers start drifting. The Compensation & Pay Band Workbook holds the bands and computes the ratio, placement, and equity screens as you type. But the method below works on a blank sheet too, so here it is either way.
How to calculate compa-ratio for a whole roster
The formula is one line — compa-ratio = salary ÷ band midpoint — so the work is not the arithmetic. It is doing it for everybody at once, which is what turns a number into a finding.
To check a single role without building anything, the Compa-Ratio Calculator is free and needs no signup. For a roster, put the whole team in one table. Here is that opening list again, with the midpoint attached to each row.
| Person | Role | Salary | Band midpoint | Compa-ratio |
|---|---|---|---|---|
| A | Support Lead | $78,000 | $79,500 | 0.98 |
| B | Support Rep | $51,500 | $58,000 | 0.89 |
| C | Support Rep | $61,000 | $58,000 | 1.05 |
| D | Ops Analyst | $71,000 | $74,000 | 0.96 |
| E | Ops Analyst | $63,500 | $74,000 | 0.86 |
| F | Office Manager | $59,000 | $55,000 | 1.07 |
Sort that table by salary and B is at the bottom. Sort it by compa-ratio and E is at the bottom — and E earns $12,000 more than B.
That inversion is the entire argument for the metric. B is a support rep paid modestly under the rate for support reps: worth a look, not an emergency. E is an ops analyst paid fourteen percent under the rate for ops analysts, sitting next to D, who does the same job for $7,500 more. E is the row most worth a second look, and nothing in the salary column was ever going to point you there.
How to get a compa-ratio midpoint without pay bands
Many small teams do not. That is the real blocker, and “go build a full band structure first” is advice that ends the project on the spot.
You do not need a band structure. You need one defensible midpoint per role, and you can assemble a usable one in well under an hour each from three inputs:
- A public salary range for the same job in your metro. Many employers now publish ranges in job listings. Take the midpoint of two or three real postings for genuinely comparable scope — and where nobody in your market posts a range, lean harder on the next two inputs.
- What you last paid to hire that role, adjusted forward for the time since. If you filled it quickly at the offered number, you were probably at or above market; if it sat open for months, you were below.
- A government or industry wage figure for the occupation, as a sanity check on the other two rather than as the answer — national medians rarely match your city.
Average the three, round to the nearest $500, and write down the date. That is your midpoint. It is not audit-grade, and it does not need to be: you are looking for someone sitting fourteen percent below the mark, and a midpoint that is five percent off still finds them.
One rule: write the date next to every midpoint. A midpoint with no date is a common reason a compa-ratio audit produces a confident wrong answer, and the explanations section below shows exactly how.
How to read a compa-ratio: the five zones
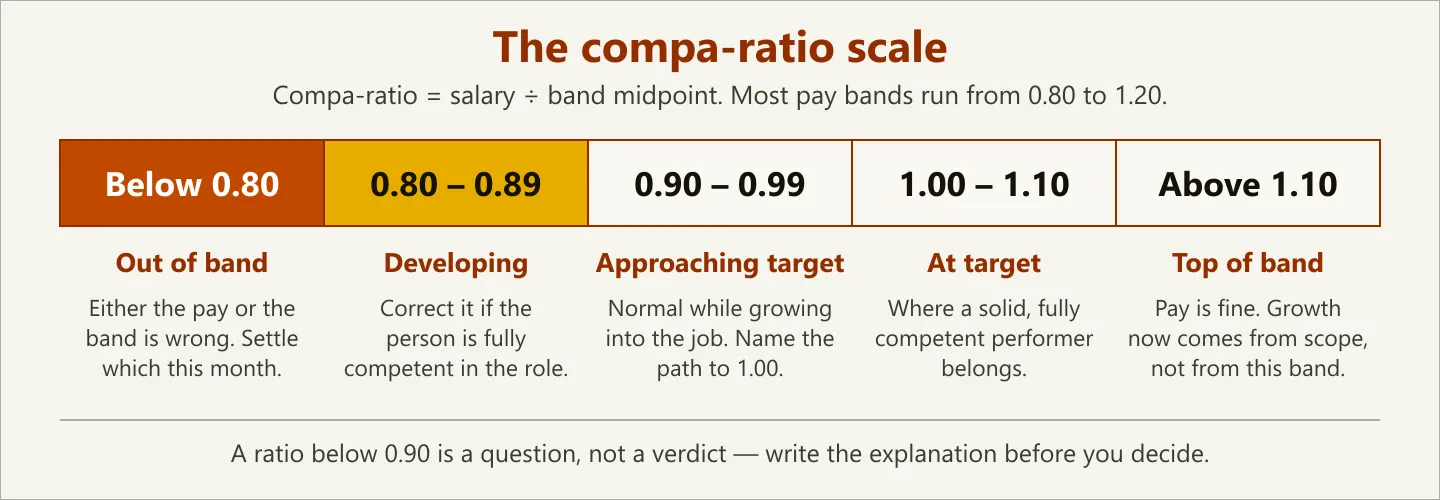
Bands are conventionally built to span roughly 0.80 to 1.20 — twenty percent either side of the target rate. Where a person sits inside that span is the finding.
| Compa-ratio | What it usually means | What to do |
|---|---|---|
| Below 0.80 — out of band | The salary has fallen out of the range entirely | Either the pay is wrong or the band is wrong — settle which this month |
| 0.80 – 0.89 — developing | Early in the band: new, growing, or overlooked | Correct it if the person is fully competent in the role |
| 0.90 – 0.99 — approaching target | Close to the rate the band targets, not yet at it | Normal while someone is growing into the job; name the path to 1.00 |
| 1.00 – 1.10 — at target | At or just above the rate the band targets | Where a solid, fully competent performer belongs |
| Above 1.10 — top of band | Near the ceiling of the range | Pay is fine — future growth has to come from scope, not from this band |
The zone that trips people up is the last one. A compa-ratio of 1.15 is not a mistake to claw back. It is a signal that this person has run out of room in their current job, which is a conversation about a bigger role — and a far cheaper conversation to have twelve months before they start looking than three months after.
How to run a compa-ratio audit in seven steps
The audit itself is an afternoon. The discipline is in the order — particularly step five, which is the one people skip.
- Pull the roster. Name, role, current salary, hire date, and the date of the last increase. The last two columns are not optional; half your explanations live in them.
- Attach a midpoint to every row. Use your band structure if you have one, the three-input method above if you do not. Date-stamp each midpoint.
- Compute the ratio. Salary divided by midpoint, two decimals.
- Sort ascending by compa-ratio — not by salary. This is the moment the audit earns its keep, and it is the step that produced the B-versus-E inversion above.
- Write the explanation for every row under 0.90 before you decide anything. One sentence per person, in writing, that you would be willing to say out loud to that person. If you cannot write it, you have found a real problem rather than an explicable one.
- Price the corrections. What would it cost to move each unexplained row to 0.95? Include employer payroll tax; the fully loaded number is the one your budget has to absorb.
- Decide what you fund, and record what you did not. The rows you consciously chose not to fix this cycle are the shortlist for next cycle. Left undocumented, they become next year’s resignation.
Steps five and seven are what separate an audit from a spreadsheet. The output of this process is not a number — it is a short list of names with a written reason beside each one.
Five explanations for a low compa-ratio, and which ones hold up
A compa-ratio of 0.86 is a question, not a verdict. Before concluding that someone is underpaid, rule these out in order. Most low ratios have an explanation; the point of writing it down is that two of the five are not explanations at all.
The time thresholds below are sensible defaults rather than standards — set your own to match your review cycle.
| Explanation | How to confirm it | Does it justify the gap? |
|---|---|---|
| Recent hire, still ramping | Hire date under twelve months ago | Yes — temporarily, with a stated date to revisit |
| The midpoint is stale | Midpoint dated more than eighteen months ago | No. The band is wrong, not the person |
| Performance genuinely below the bar | Documented review history, not recollection | Yes, if it is documented and the person knows |
| Scope is smaller than the band assumes | Compare actual duties to the band’s role definition | Maybe — or the person is in the wrong band |
| Nobody has looked at it in years | No increase in twenty-four months or more | No. This is the gap, not a reason for it |
The stale-midpoint case is the one that catches good managers, and it is why step two asks for a date. If your ops analyst midpoint was set two years ago and market pay for that role has moved since, then E’s compa-ratio of 0.86 is understating the problem — measured against a current midpoint it would be worse. A drifting band makes underpayment look like a smaller number every year it goes unrefreshed.
The performance case has a related trap. “They are just not a strong performer” is a legitimate reason for a below-midpoint salary only if it is written down somewhere the person has seen. If the only record of the concern is in your head, you do not have a performance explanation — you have an undocumented pay gap and an unaddressed performance issue, which is two problems. A structured review and calibration record is what turns that sentence into something defensible.
Two of the five explanations, then, are findings in disguise. “No one ever looked” is a common place for a below-midpoint row to land, and it is the one nobody wants to write down.
Group compa-ratio, and where averages mislead you
Once you have a ratio for every person, averaging it by group — department, tenure, level — is usually where a pay-equity review starts. It is worth doing, and it is worth being careful about.
Worth doing, because the pattern it detects is real and large in aggregate. Across US full-time wage and salary workers in 2025, women had median weekly earnings of $1,089, or 82.1 percent of the $1,326 earned by men (opens in new tab), according to the Bureau of Labor Statistics. That is a raw comparison of what full-time workers earn, not a comparison of pay for the same job — it is not adjusted for occupation, industry, or hours. Which is precisely why a within-band, same-role measure like compa-ratio is the useful instrument at the level of a single employer: it strips out “different jobs pay differently” and leaves the part you actually control.
Worth being careful about, for three reasons:
- Small groups hide almost everything. A four-person group average of 0.97 can contain a 0.86 and a 1.08. Always look at the individual rows, not only the group mean.
- A clean average is not a clean audit. Two people can offset each other perfectly and both be wrong.
- Job titles are not job content. The EEOC is explicit that under the Equal Pay Act, “job content (not job titles) determines whether jobs are substantially equal (opens in new tab)”. Two people with the same title in different bands, or different titles doing the same work, will produce a comparison that means nothing until the banding is fixed.
That last point is the one to act on first. If your audit surfaces something that looks like a group pattern, the very next step is to confirm the roles are genuinely comparable in content — not to schedule a difficult meeting.
What it costs to fix a low compa-ratio
Managers avoid running this audit because they are afraid of the answer. The answer is usually smaller than the fear.
Take the six-person table above. Two rows need correcting: E at 0.86 and B at 0.89. Moving both to 0.95 — not to the midpoint, just to the bottom edge of “fine” — costs this:
| Line | Current salary | Salary at 0.95 | Increase |
|---|---|---|---|
| E (Ops Analyst) | $63,500 | $70,300 | $6,800 |
| B (Support Rep) | $51,500 | $55,100 | $3,600 |
| Subtotal | — | — | $10,400 |
| Employer payroll tax at 7.65% | — | — | $796 |
| Total annual cost | — | — | about $11,200 |
Around eleven thousand dollars a year to close both gaps on a six-person team. Set that against what it costs to replace E — the recruiting spend, the empty seat, the months before a replacement is fully productive, and the fact that the replacement gets hired at today’s midpoint anyway, which is more than E is currently being paid. Whether that comes to less than replacing E is arithmetic you can do with your own recruiting costs — and correcting the pay is the only path where the institutional knowledge stays in the building.
Two practical notes on funding it. First, corrections and merit increases are different budgets and should be argued separately — a correction fixes a mistake you already made, and folding it into someone’s annual merit pool makes them pay for your error out of their raise. Second, if the total is more than you can fund at once, sequence it rather than diluting it: three people at 0.86 moved fully to 0.95 is a real fix, while six people given a token two percent is a rounding error that has now also told six people you know they are underpaid.
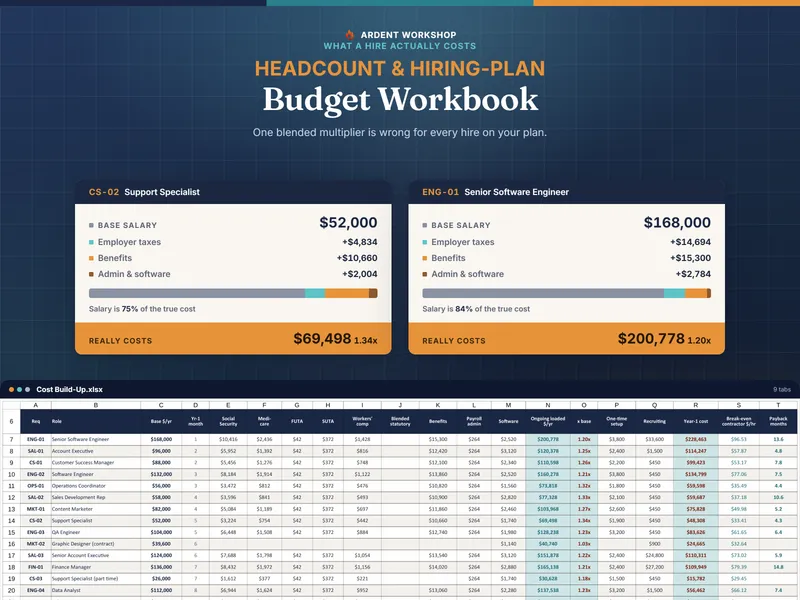
If the fix has to be traded against open headcount — funding corrections instead of a new hire, or the other way round — that trade is easier to see when both sit in the same model. A headcount and hiring budget workbook puts the correction cost and the cost of the next hire on the same page, which is where the argument actually gets settled.
When the budget only stretches to one person and there are several defensible candidates, that is a different problem with a different method — this post finds who is mispaid, not who earns the raise. The full framework for that is in how to decide who gets a raise.
What compa-ratio cannot see
Every metric has a blind spot, and the honest version of a metric post names them. Compa-ratio has five.
- Total compensation. It measures base salary against a base-salary midpoint. A 0.90 with a meaningful bonus and a 0.90 without are not the same situation.
- Market movement. The ratio is only as current as the midpoint. It measures a person against your band, not against the market, and those two diverge quietly.
- Internal equity across bands. It tells you whether someone is paid correctly for their band. It says nothing about whether they are in the right band, which is the more expensive mistake.
- Part-time and partial-year staff. Compare full-time-equivalent salary to the midpoint, or a four-day-week employee will look catastrophically underpaid.
- Geography. A single national midpoint applied to a distributed team makes everyone in high-cost cities look underpaid and everyone else look generously paid.
None of these makes the number less useful. They make it a first screen rather than a verdict — which is exactly the job it is good at. It takes a roster you cannot read and hands you a few names to look at properly.
Common Questions About Compa-Ratio
What is a good compa-ratio?
A compa-ratio between 0.95 and 1.05 is generally healthy for a fully competent person in the role, because it sits close to the midpoint the band was built to target. Below 0.90 deserves an explanation you would be willing to say out loud to the person; above 1.10 is not a problem to fix, but it does mean future pay growth has to come from a bigger role rather than a bigger number in the same band.
Can a compa-ratio be over 1.00?
Yes. A compa-ratio above 1.00 simply means the salary sits above the band midpoint, which is exactly where a long-tenured, consistently strong performer should be. The midpoint is the target rate for full competence, not a ceiling — bands conventionally extend to roughly 1.20, and a band where nobody sits above 1.00 is usually a band that has been set too high.
How often should you run a compa-ratio audit?
Once a year, timed to land about two months before your compensation budget is set, is enough for most teams. Run it again out of cycle whenever you rewrite a band, absorb a team through a reorganization, or notice that new hires are arriving at or above the salaries of people who have been doing the job for years — that last signal means the band moved and your existing staff did not.
Does compa-ratio work without formal pay bands?
Compa-ratio needs a midpoint, but the midpoint does not have to come from a formal band structure. A defensible midpoint assembled from a few current market data points is enough to start, and it will surface the same outliers a formal band would. Date it, write down where each input came from, and refresh it annually — an undated midpoint is worse than no midpoint, because it produces a confident number that is quietly wrong.
Why compa-ratio outranks the salary column
Go back to the six salaries at the top. The largest was $78,000 and the smallest was $51,500, and neither of those facts identified the person most at risk of resigning.
That is the whole case for compa-ratio. It costs one division per employee. It requires no software, no consultant, and no band structure you do not already have. And it converts a column of numbers that cannot be compared into a column that can — which means the next time someone asks whether your team is paid fairly, you have an answer with names in it rather than a feeling.
Run it once. Sort ascending. Then write the sentence next to every name below 0.90, and see how many of those sentences you would actually be willing to read out.
The Compensation & Pay Band Workbook was built for exactly this pass — bands and midpoints in one place, compa-ratio and range placement computed per person, and the group screens already wired up, so the afternoon goes on the explanations rather than on the arithmetic. If pay is one of several things you are trying to get onto a defensible footing at once, it also ships inside the HR manager toolkit bundle alongside the review, onboarding and documentation kits.
And if you are setting a number rather than auditing one — a first employee, a first band, no history to measure against — start with how much to pay your first employee instead.