What goes into the cost of turnover
A replacement cost is the sum of several buckets, most of which never touch a single invoice:
- Recruiting — job ads, agency or referral fees, and the hours your team spends sourcing, screening, and interviewing.
- Onboarding and training — equipment and setup, formal training, and the time colleagues and managers spend bringing the new hire up to speed.
- Lost productivity while the seat is empty — the work that does not get done, or lands on the rest of the team, between the departure and the replacement's first day.
- Ramp time — the weeks or months a new hire takes to reach full effectiveness, during which you are paying a full salary for partial output.
Why it is always an estimate — and why that is fine
You will never get an exact, auditable figure for the cost of a single departure, because most of the cost is time and lost output rather than cash that changed hands. Published estimates of replacement cost vary widely — from a fraction of a person’s annual salary to well over it, depending on the role, its seniority, and how hard it is to fill. That range is wide enough that a precise-looking number would be false precision. The value of the estimate is not the exact dollar figure; it is the relative picture — which teams, which roles, and how much of the cost sits behind exits you wanted to prevent.
Cost scales with seniority and specialization
Not every departure costs the same. A senior or specialized role costs far more to replace than an entry-level one: the search takes longer, the ramp is slower, and the productivity gap while the seat is empty is wider and more damaging. That is why a useful cost model sets a replacement-cost estimate per role level rather than one flat number — so the total reflects who actually left, not just how many.
How to use the number
The cost of turnover earns its keep as a comparison, not a headline. Break it out by team to see where the money is going. Break it out by tenure to see how much you are paying for early attrition — first-year exits are among the most expensive relative to what you got back, because you paid the full hire-and-ramp cost and captured little of the return. And separate the cost of regrettable and voluntary exits from the rest: that figure is the budget a retention fix competes against. If a change to pay, workload, or management would cost less than the turnover it prevents, the case makes itself.
Cost of turnover vs. turnover rate
The turnover rate counts departures; the cost of turnover weighs them. A team with a modest rate but several senior exits can cost more than a team with a high rate of junior churn. Read the two together: the rate tells you how much movement there is, the cost tells you how much it matters, and the regrettable split tells you whether it is the right or the wrong people moving.
Related templates and concepts
The cost of turnover is one cut of your exit data. To capture an exit for free, the exit-interview form is an ungated taste; the full Exit-Interview & Turnover-Analytics Workbook estimates the cost across every departure on a model you control, alongside the regrettable split. The risk that a single costly departure represents is the bus factor, and the decision to protect against it is cross-training. See how the workbook compares to HR analytics software, or browse the templates for HR & team leads hub.
Templates that implement this
Estimate your cost of turnover
2 templates
Set a replacement-cost estimate per role level and the workbook totals it across your departures, by team and tenure — one owned file.
- $24.95 Spreadsheet

Exit-Interview & Turnover-Analytics Workbook for Excel & Google Sheets
An exit-interview and turnover-analytics workbook for Excel & Google Sheets — log departures and see turnover rate, regrettable split, reasons, and cost.
Team & TalentView details - $24.95 Spreadsheet
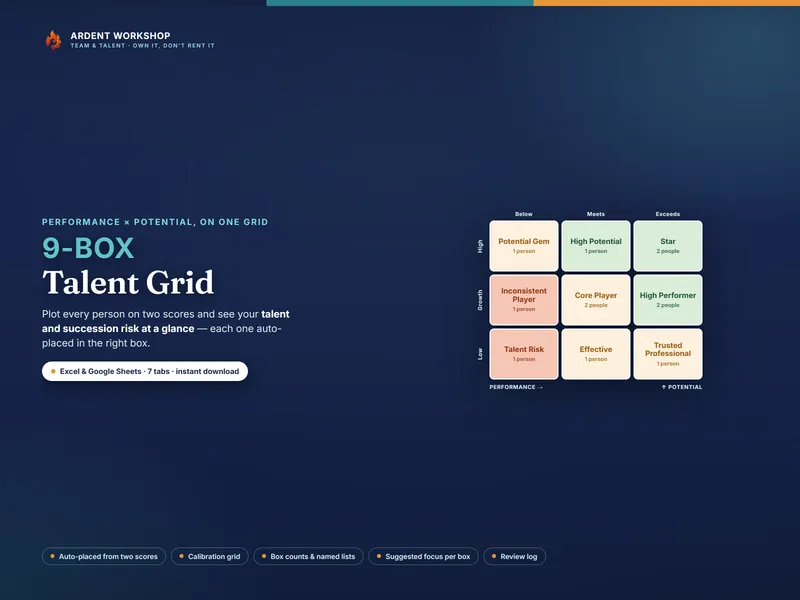
9-Box Talent Grid — Performance & Potential Matrix for Excel & Google Sheets
A 9-box talent grid for Excel & Google Sheets — score performance and potential, auto-place each person, and see succession risk on one grid.
Team & TalentView details