The resignation always looks sudden from the outside. Someone good, someone reliable, someone who never complained, asks for fifteen minutes on a Tuesday and says they’ve accepted something else. You spend the rest of the week telling people you had no idea.
Here’s the thing: you did have the idea. It was in your files.
The observable signs of employee burnout rarely arrive as a conversation first. They arrive as scheduling data — hours that stop balancing, time off that stops getting used, one name that keeps appearing in every coverage slot.
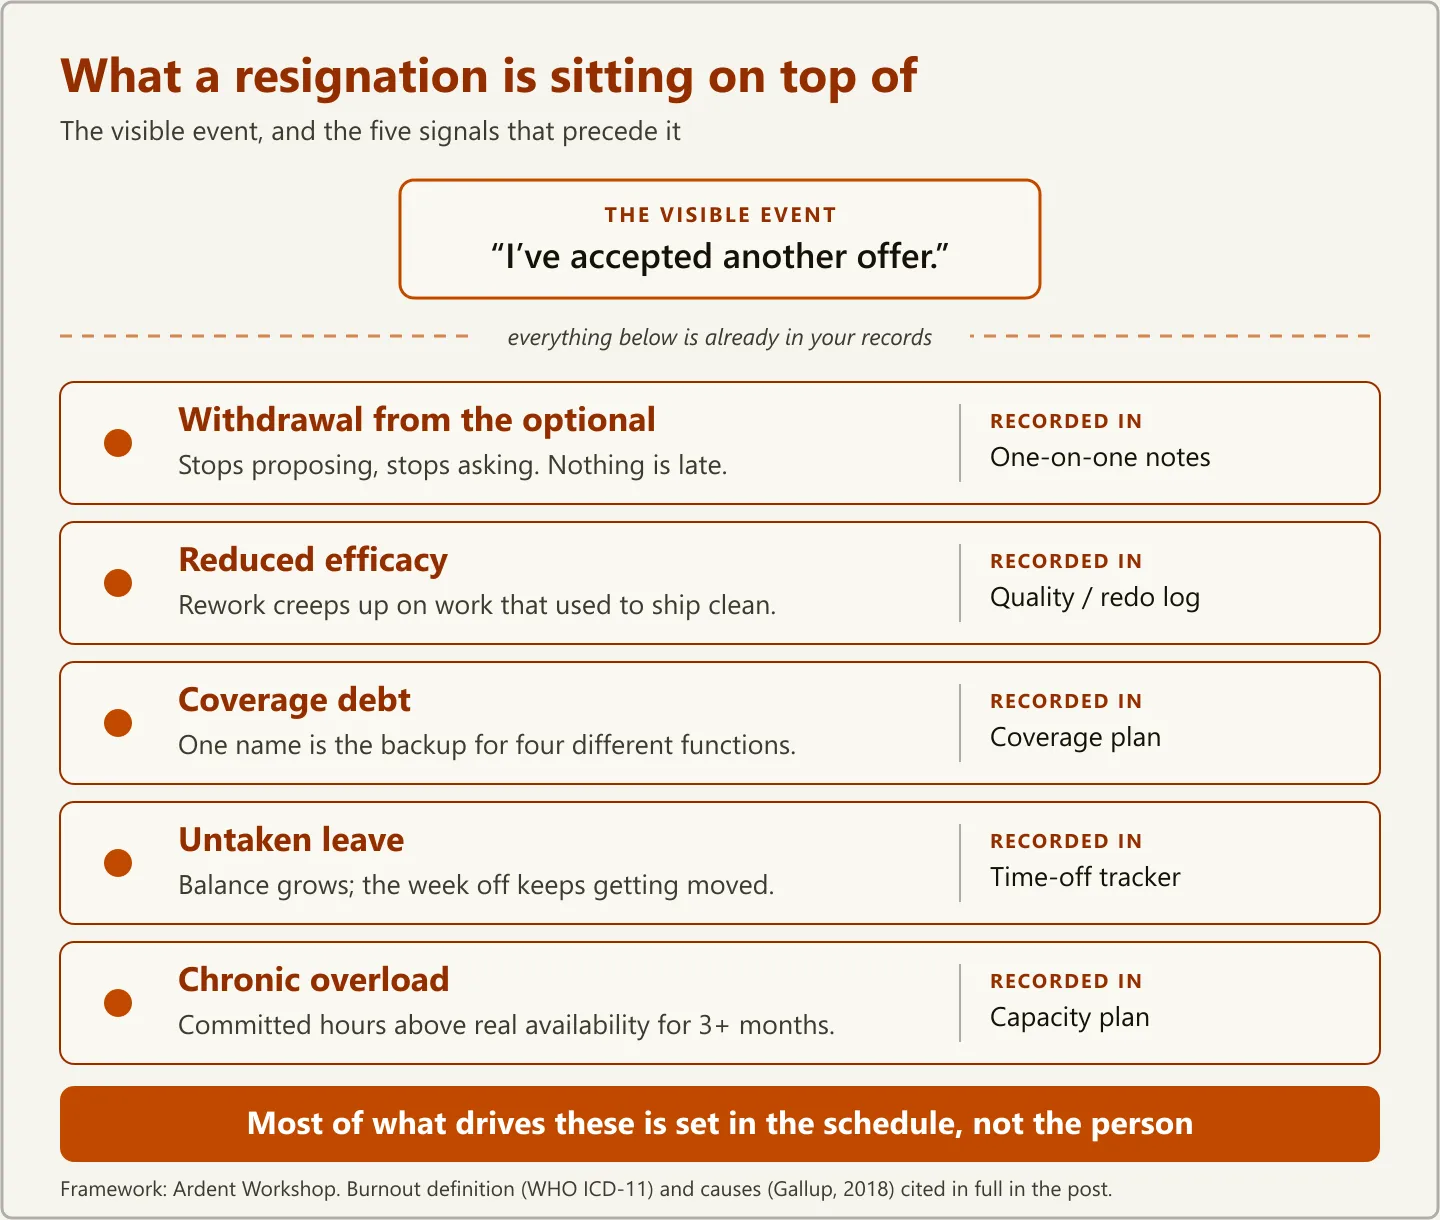
The five signs of employee burnout you can see in your own records are chronic overload (committed hours above real availability for three months or more), untaken leave, coverage debt (one person is the named backup for several functions), reduced efficacy (rework creeping up on work that used to ship clean), and withdrawal from the optional. Every one of them is already written down in a capacity plan, a leave tracker, a redo log, or your one-on-one notes.
What Burnout Actually Is (And Why “They Seem Fine” Isn’t Evidence)
Burnout is a syndrome conceptualized as resulting from chronic workplace stress that hasn’t been successfully managed. That’s the World Health Organization’s ICD-11 definition (opens in new tab), which classifies burn-out as an occupational phenomenon rather than a medical condition — something the WHO frames as arising from the job, not carried into it.
The definition has three dimensions, and this is the part worth memorizing:
- Energy depletion or exhaustion — the tiredness everyone pictures.
- Increased mental distance from the job, or cynicism about it.
- Reduced professional efficacy — the sense of no longer being good at the work.
Only the first one looks like being tired. The second and third look like something else entirely: a person who has quietly stopped volunteering ideas, or who is suddenly making the kind of small mistake they’ve never made before. Those two are the ones easiest to miss, because they don’t read as distress. They read as a shrug.
That matters because “they seem fine” is a test almost everyone passes. People are good at being fine for the few minutes a week you’re standing at their desk. What they can’t do is manufacture a schedule that balances.
The 5 Signs of Employee Burnout You Can See in Your Own Records
These five signals share one property: each of them is already written down somewhere you control. You don’t need a survey, a pulse tool, or a wellness budget to find them — you need to look at data you’re already generating.
The middle column maps each signal to the WHO dimension it most plausibly reflects. That mapping is our reading, not part of the ICD-11 entry — the WHO defines the three dimensions of the syndrome, not which spreadsheet they surface in.
| Signal | What it looks like | Dimension it likely reflects | Where it’s already recorded |
|---|---|---|---|
| Chronic overload | Committed hours above available hours for 3+ months running | Energy depletion | Capacity or workload plan |
| Untaken leave | Balance grows; requests get canceled or “moved to next quarter” | Energy depletion | Time-off tracker |
| Coverage debt | Same person is the backup for four different things | Energy depletion | Coverage plan |
| Reduced efficacy | Redos, missed details, work that used to ship clean | Reduced efficacy | Quality or redo log |
| Withdrawal from the optional | Stops proposing, stops asking, does exactly the assignment | Mental distance | One-on-one notes |
1. Chronic overload: utilization that never returns to baseline
Of the five, chronic overload is the easiest to see in a file — a person whose committed hours have exceeded their real available hours for three months or more. One overloaded month is a project. Three consecutive overloaded months is a trajectory.
The trap is that overload is usually introduced as temporary. A colleague leaves, a launch slips, a seasonal rush runs long — and the extra load gets absorbed with an implicit “just until things settle.” Then the thing that was supposed to settle becomes the new baseline, and nobody ever formally decides that it should be. The only way to catch this is to compare committed hours against genuinely available hours — after holidays, planned leave, meetings, and the administrative overhead that never appears on a project plan.
2. Untaken leave: time off that stops getting used
A growing time-off balance is not thrift. It is often the earliest financial trace of a workload problem.
Pew Research Center found in 2023 (opens in new tab) that 46% of U.S. workers who get paid time off take less than they’re offered — and among the reasons they gave, 49% said they’d worry about falling behind at work and 43% said they’d feel badly about co-workers picking up the extra load. Notably, managers were more likely than non-managers to under-use their own time off (54% vs. 42%), which is worth sitting with if you’re the one reading this.
Read that second reason carefully, because it’s diagnostic. When someone won’t take a week off because of what it would do to everyone else, they are telling you the coverage plan doesn’t exist. That’s not a personality trait to admire. It’s a structural gap you’re currently financing with one person’s stamina.
3. Coverage debt: one name in every coverage slot
Look at who backs up what. If a single person is the named fallback for more than two functions — and four is not unusual — they are carrying a load that appears nowhere in their job description and nowhere in their hours.
This is the same person who is also your single point of failure, which is why the burnout risk and the continuity risk are usually the same line item — a pattern worth understanding in its own right if you’ve never mapped what the bus factor means for a small team. The burnout angle is the more urgent one, because a bus factor of one only hurts you when something goes wrong, while coverage debt is charging interest every single week.
4. Reduced efficacy: rework that creeps upward
Reduced professional efficacy is the third WHO dimension. In records, the closest proxy is rework: the redo, the missed detail, the draft that needs a second pass when it never used to.
The instinct here is the trap. A capable person whose error rate has drifted upward looks, on a bad day, like a performance problem — and the reflex is more scrutiny, which adds load to someone who is already over capacity and is likely to make the thing you’re measuring worse. If output quality slipped on someone who used to be reliable, check the hours before you check the person. (If the hours are genuinely fine and the work still isn’t, that’s a different situation with a different playbook — see how to manage an underperforming employee.)
5. Withdrawal from the optional: the signal that only shows up in your notes
The last signal is the quietest one, and it’s the one that maps to mental distance. The person stops proposing things. They stop asking clarifying questions. They complete exactly what was assigned and nothing adjacent to it. Nothing is late. Nothing is wrong. Something is just gone.
This one leaves a trace only if you keep notes from your one-on-ones — which is the real argument for keeping them. A single flat conversation is noise. As a working threshold, we’d start paying attention at four in a row from someone who used to arrive with a list.
Why Burnout Is a Scheduling Problem Before It’s a Morale Problem
The most actionable finding here is about causes, and it is more useful to a manager than most people expect.
In a 2018 Gallup study of nearly 7,500 full-time employees (opens in new tab), the five main causes of employee burnout were unfair treatment at work, unmanageable workload, lack of role clarity, insufficient communication and support from a manager, and unreasonable time pressure. Employees who strongly agreed that they feel supported by their manager were about 70% less likely to experience burnout on a regular basis, and those who said they often or always had enough time to do their work were also 70% less likely to report high burnout. (Gallup titles these the five main causes; the underlying analysis identifies them as the factors most highly correlated with burnout.)
Gallup names five leading causes. Three of them — workload, role clarity, and time pressure — are things you settle in a schedule and a roles document. Which is our point, not Gallup’s: none of those three is settled by a wellness benefit.
That’s the whole reframe. Burnout gets treated as a feelings problem and answered with feelings-shaped solutions: a mental health app, a “no-meeting Friday,” a message about work-life balance sent at 9:40 p.m. Meanwhile the actual causes sit in a spreadsheet nobody has opened since the last reorg.
It’s worth noting what the list does not say. The first item on Gallup’s list — unfair treatment at work — is not a scheduling matter at all. The schedule is where most of this gets decided, not all of it.
It also explains why this lands on you specifically. Gallup’s 2015 analysis across 2.5 million work units found that managers account for at least 70% of the variance in engagement scores across business units (opens in new tab) — which is to say the person who assigns the work and decides what’s realistic moves the number more than anything else measured.
What Burnout Actually Costs You
Burnout has a price before anyone resigns, and then a much larger one after.
The same 2018 Gallup research found that burned-out employees are 63% more likely to take a sick day, 2.6 times as likely to be actively seeking a different job, and report 13% lower confidence in their own performance. So the pre-resignation cost is already showing up as absence, as recruiter conversations happening on your payroll, and as work that takes longer than it should.
Then there’s the replacement. A 2019 Gallup analysis puts the cost of replacing an individual employee at one-half to two times their annual salary (opens in new tab) — and calls that a conservative estimate. The same analysis found that 52% of voluntarily exiting employees say their manager or organization could have done something to prevent them from leaving.
The table below is a worked example, not a survey result: it applies Gallup’s 0.5x–2x range to a hypothetical role paid $52,000.
| Cost layer | Illustrative amount | Notes |
|---|---|---|
| Replacement cost (low end, 0.5x) | $26,000 | Recruiting, hiring, ramp time |
| Replacement cost (high end, 2x) | $104,000 | Specialized or hard-to-fill roles |
| Coverage during the gap | Weeks of someone else’s capacity | Usually absorbed by whoever is already overloaded |
| Second-order risk | Next quarter’s flight risk | The person absorbing the gap becomes the next signal |
The point isn’t the precise number. It’s that the last row is the one that turns a single resignation into a pattern, and it’s the row that never gets budgeted.
The Monthly 20-Minute Burnout Check
You do not need a program for this. You need one recurring appointment with yourself, and a file that holds the numbers behind the six checks below.
- Recalculate real availability, not nominal availability. Start from contracted hours, then subtract holidays, booked leave, standing meetings, and a realistic allowance for administrative overhead. The gap between nominal and real availability is easy to underestimate, and it is where overload hides.
- Compare committed hours to that number, per person, per month. You’re looking for anyone above 100% — and specifically for anyone who has been above 100% for three months running. A team capacity and utilization planner does this netting for you and flags the people whose utilization never comes back down, which is the signal that’s almost impossible to see one week at a time.
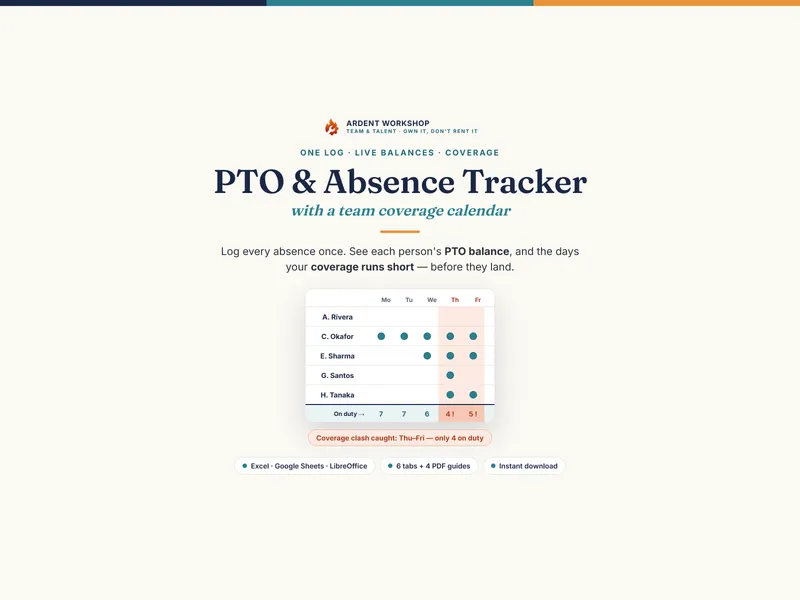
- Check who hasn’t taken time off. Sort by unused balance, descending. The top of that list and the top of your utilization list are frequently the same person, and when the same name tops both, that overlap is the one we’d act on first. A PTO, absence, and coverage tracker keeps the balances and the coverage gaps on the same page, so you can see whether the reason someone isn’t booking leave is that nobody could cover it.
- Count names in the coverage column. As a working threshold, we’d treat any person appearing as backup for more than two functions as carrying invisible load. Fixing this is a cross-training problem, not a scheduling one — a cross-training and coverage planner maps who can cover what and shows exactly where you’re one deep. It’s also the prerequisite for building a vacation coverage plan for a small team that people will actually use.
- Check the redo log for drifting rework. Look for anyone whose rework rate has climbed on work that used to ship clean — and check their hours before you check the person.
- Scan your one-on-one notes for the withdrawal pattern. Four consecutive conversations where someone brought nothing of their own is worth a direct question.
Run that list monthly and overload tends to surface while it’s still a scheduling decision rather than a resignation. Twenty minutes is genuinely enough, because the point of the exercise isn’t precision — it’s noticing a direction.
What to Say When the Numbers Say Someone Is Overloaded
Finding the signal is the easy half. The conversation is where it usually stalls, often because it opens with a version of “are you doing okay?” — a question that invites the answer “yeah, fine” and closes the subject for another month.
Ask about the work instead of the feelings:
- “You’ve been over capacity since March. Which of these four things should come off your plate?”
- “You haven’t taken time off since last fall. What would need to be true for you to take a week in September?”
- “You’re the backup for four things. Which one should we train someone else on first?”
Each of those is answerable, specific, and puts a decision in front of both of you rather than a mood. They also hand the person something they may not have felt permitted to say out loud: that the load is not sustainable and it is not their private failure for finding it heavy.
Ask before there’s a crisis. That’s the entire logic of the stay interview, which asks why someone stays while they still are staying — and a stay interview and retention risk tracker gives those conversations a structure and a place to record the answers so patterns become visible across a team.
Then make it recurring rather than a one-off. A single conversation resets nothing; the pattern is what you are managing. A one-on-one meeting and goal tracking workbook keeps the carry-forward history that turns four flat conversations into an actual signal instead of a vague feeling you can’t justify.
The Takeaway
Burnout is not a mystery that reveals itself in a moment of honesty. It’s a slow structural failure with a documented paper trail: hours over capacity, leave that goes untaken, coverage that rests on one person, quality that drifts, and a person who stops offering anything extra.
None of this requires a platform. It requires a file you own, updated once a month, that holds capacity, coverage, leave, and notes in the same place — a workbook you keep does the same job and doesn’t stop working when a subscription does.
Every one of those signals is already in your records. The only question is whether anyone is scheduled to look.
Sources and Methodology
Every statistic above is linked inline at the point of claim. Consolidated here with publication years, since several of these findings are several years old:
- World Health Organization: Burn-out an “occupational phenomenon” (ICD-11) (opens in new tab), 2019 — the definition of burn-out and its three dimensions.
- Gallup: Employee Burnout, Part 1 — The 5 Main Causes (opens in new tab), 2018 — the study of nearly 7,500 full-time employees behind the five causes, the two 70% figures, and the 63% / 2.6x / 13% impact figures.
- Gallup: This Fixable Problem Costs U.S. Businesses $1 Trillion (opens in new tab), 2019 — the one-half to two times annual salary replacement cost and the 52% preventable-turnover figure.
- Gallup: Managers Account for 70% of Variance in Employee Engagement (opens in new tab), 2015 — the manager’s share of engagement variance across business units.
- Pew Research Center: More than 4 in 10 U.S. workers don’t take all their paid time off (opens in new tab), 2023 — the 46% figure, the reasons given, and the manager/non-manager split.
The mapping of each signal to a WHO dimension, the monthly check, and the thresholds suggested in it are our own framework, not findings from the sources above.
Disclaimer: This post is for informational and educational purposes only and does not constitute legal, human resources, or medical advice. Employment law, leave entitlements, and accommodation obligations vary by jurisdiction and by employer, and burnout can overlap with health conditions that require professional care — consult a licensed employment attorney, a qualified HR professional, or a healthcare provider before making decisions based on this content.