What an A1C actually measures
Glucose in your blood attaches to hemoglobin, the protein that carries oxygen in your red blood cells. Because those cells live for a few months — and more recent glucose counts the most — the share of hemoglobin carrying glucose reflects your average blood sugar over roughly the past two to three months. The A1C test reports that share as a percentage — a higher number means a higher average. Unlike a finger-stick, which is a single moment, the A1C can't be gamed by one good morning; it's the average of every high and low across months.
A1C and estimated average glucose (eAG)
An A1C percentage can be expressed as an estimated average glucose (eAG) in the same mg/dL units your meter uses, with a standard formula: eAG = 28.7 × A1C − 46.7. So an A1C of 7% works out to an estimated average of about 154 mg/dL. This is an estimate, not a substitute for the lab result — but it's a useful way to connect the lab number to the readings you see every day. A good blood-sugar log will compute it for you.
A1C vs your daily readings
They answer different questions, and they're most useful side by side. Your daily readings show the day-to-day pattern — which meals spike you, whether mornings run high, where the lows fall. Your A1C shows the long average those readings add up to. A falling A1C alongside a rising percent-in-range is the trend most people are hoping to see; the daily log explains what the lab number summarizes. If your logged average and your A1C disagree by a lot, that's worth mentioning to your care team — it can happen, and it's useful for them to know.
Your A1C target is personal
There is no single "right" A1C for everyone. A common general goal for many non-pregnant adults is under 7%, but your care team may set yours higher or lower on purpose — depending on your type of diabetes, your age, other conditions, and pregnancy. Ask what your target should be, and track toward that. This is general information, not medical advice: your doctor or diabetes educator sets your goal and your plan.
How to keep your A1C history
Log each A1C result with its date, and keep it beside your daily readings so the trend is visible. The free Glucose Log starter is a good first step for the daily numbers; the full Blood-Sugar / Diabetes Log adds an A1C & Trend tab that estimates the average glucose each result reflects and tracks the trend toward your goal. For the wider picture, see how a blood-sugar log for your doctor turns a month of readings into a productive visit, or weigh a spreadsheet vs a diabetes app. A record-organizing approach — not medical advice, and not a substitute for the lab or your clinician.
Templates that implement this
Track your A1C and your daily numbers together
3 templates
A workbook that logs your readings in context, flags each one against your targets, and keeps your A1C history with an estimated average glucose and the trend toward your goal — a record you own.
- $12.95 Spreadsheet

Blood-Sugar / Diabetes Log — Glucose Tracker with Auto In-Range Flags, A1C Trend & Doctor Summary (Excel + Google Sheets)
A downloadable Excel and Google Sheets recordkeeping template for logging glucose readings, tracking A1C records and preparing a summary for appointments. This is a digital spreadsheet, not medication or a medical device. Targets are entered by the user with their care team.
Life AdminView details - $18.95 Spreadsheet
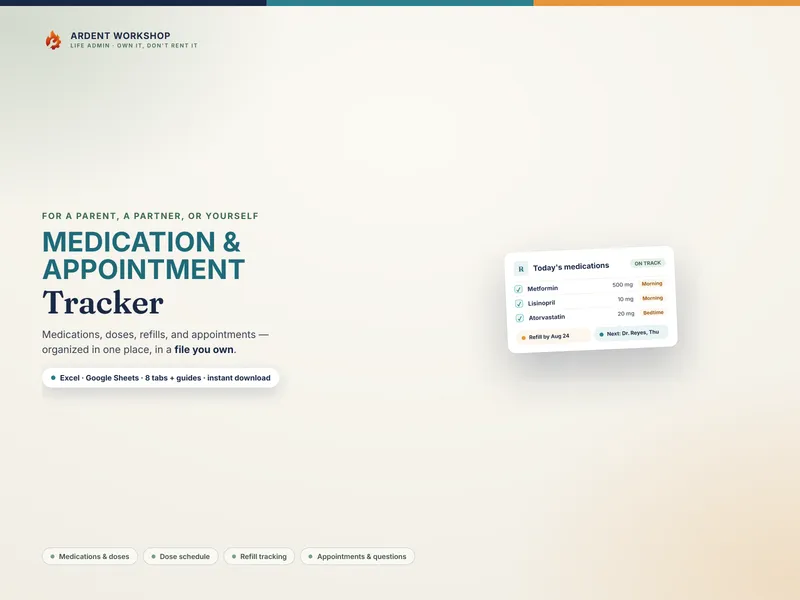
Medication & Appointment Tracker — Medication List, Dose Schedule, Refill & Appointment Organizer (Excel + Google Sheets)
A medication and appointment tracker to organize medications, doses, refills, and upcoming appointments in one file you own (Excel + Google Sheets).
Life AdminView details - $4.95 Excel
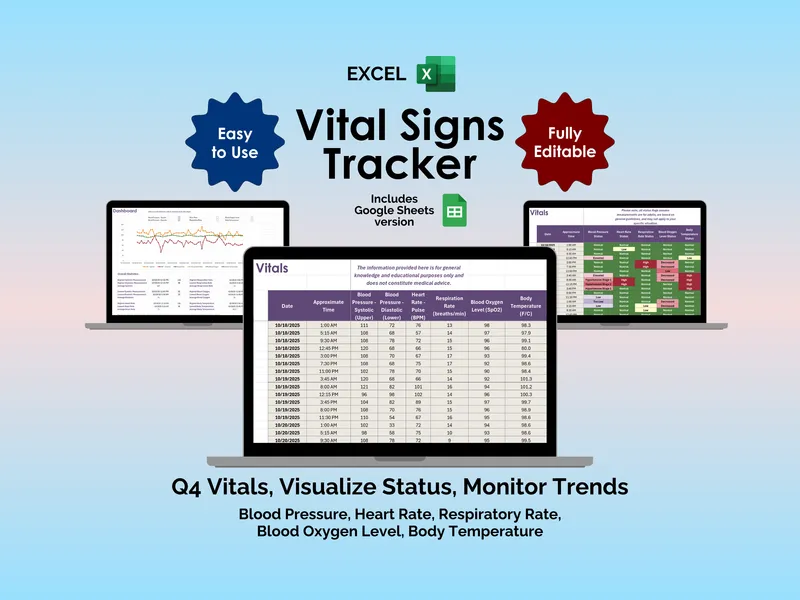
Vital Signs Tracker - Excel
Nobody warns you how loud a quiet number can feel. This excel vital signs tracker logs blood pressure, heart rate, SpO2, and temperature in one steady place.
Life AdminView details