For decades, one number summed up how diabetes was going: the A1C, a lab blood test that estimates your average glucose over roughly the past two to three months. Ask anyone who manages blood sugar what their “number” is and that is the answer you get. That is changing. Continuous glucose monitors have made a second headline number routine, and it now sits in the American Diabetes Association’s (ADA’s) own glycemic goals right next to A1C. It is called time in range, the share of the day your blood sugar spends between 70 and 180 mg/dL, and it answers a question A1C never could: how did the hours actually go?
What is time in range?
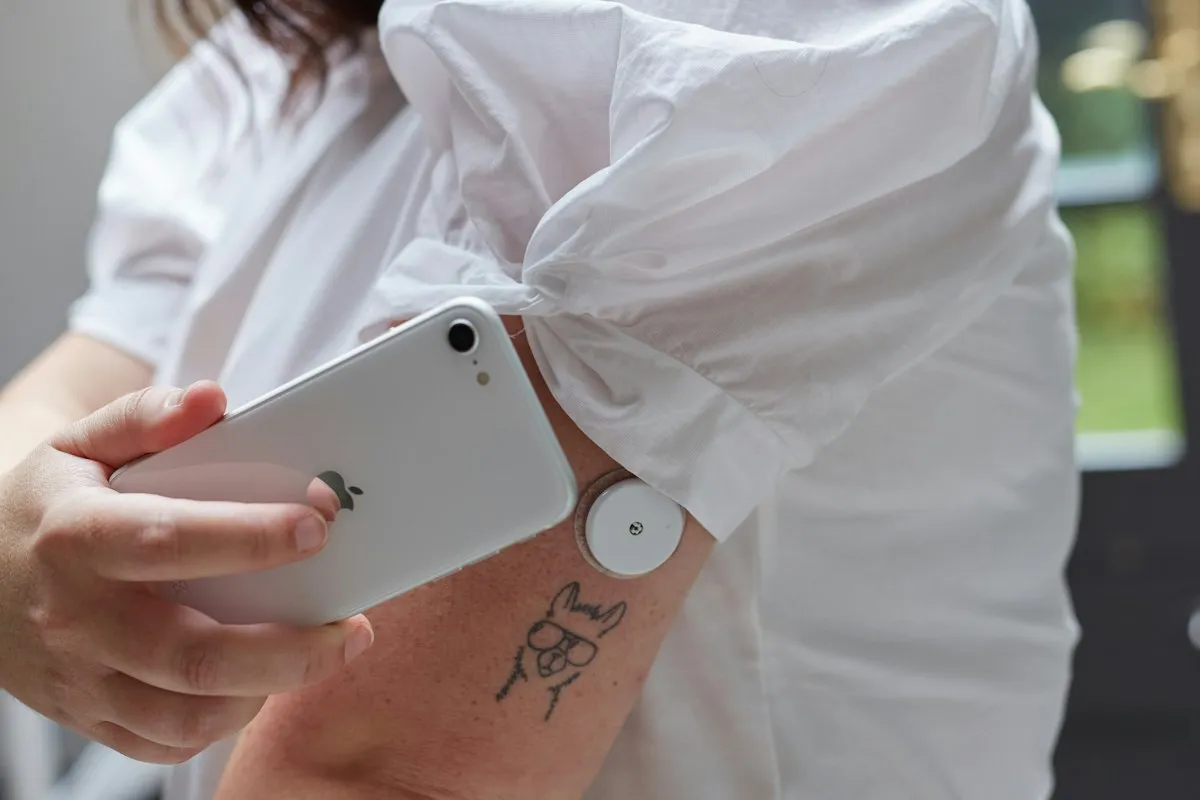
Time in range (TIR) is the percentage of time your blood glucose spends between 70 and 180 mg/dL (milligrams per deciliter), or 3.9 to 10.0 mmol/L (millimoles per liter), measured by a continuous glucose monitor (CGM). A TIR of 70% means your glucose was inside that band for about 70% of the day — roughly 16 hours and 48 minutes out of 24.
The definition and its targets come from the International Consensus on Time in Range, published in Diabetes Care in 2019 (opens in new tab), which standardized how CGM data should be read and reported. CGM reports built on that standard use the same 70–180 band for most nonpregnant adults.
If you test with a finger-stick meter instead, you do not get a true TIR — but you can get close to the question it asks by logging every reading with its context and counting how many land in your range. The Blood-Sugar / Diabetes Log does that counting for you: it flags each reading In range, High or Low against the targets you set with your care team, and its dashboard shows your percent in range for the month. There is an honest section below on how that number differs from a CGM’s.
Why A1C needed a second number
A1C is an average, and an average hides whatever cancels out. The ADA’s Standards of Care in Diabetes—2026 (opens in new tab) says it plainly: “A1C does not provide a measure of glycemic variability, real-time glucose levels, or hypoglycemia.”
Time in range exists because of that gap. A1C tells you where the average landed. TIR, and the numbers that come with it, tell you how you got there — including the lows, which an average can bury completely.
The five numbers on a time-in-range report
A time-in-range report is really five numbers, not one. The consensus defines three zones — below range, in range and above range — and splits the two outer zones into a mild and a serious band. Here are the targets for most adults with type 1 or type 2 diabetes, as published in the 2019 consensus (opens in new tab) and adopted in Table 6.2 of the ADA’s 2026 Standards of Care (opens in new tab):
| Metric | Glucose band | Goal | About how long per day |
|---|---|---|---|
| Time in range (TIR) | 70–180 mg/dL (3.9–10.0 mmol/L) | more than 70% | more than 16 hours 48 minutes |
| Time below range, level 1 | under 70 mg/dL (3.9 mmol/L) | less than 4% | less than 1 hour |
| Time below range, level 2 | under 54 mg/dL (3.0 mmol/L) | less than 1% | less than 15 minutes |
| Time above range, level 1 | over 180 mg/dL (10.0 mmol/L) | less than 25% | less than 6 hours |
| Time above range, level 2 | over 250 mg/dL (13.9 mmol/L) | less than 5% | less than 1 hour 12 minutes |
Two things about that table are easy to miss:
- Each outer zone’s goal counts both of its levels. The ADA’s table notes that its under-70 goal covers level 1 and level 2 lows combined, so the readings under 54 count toward it too — and its over-180 goal likewise covers both levels of highs.
- The goals are much tighter at the bottom than the top. Up to six hours a day above 180 is within goal; more than 15 minutes a day under 54 is not. The targets treat lows as the more urgent problem.
Time in range targets for older adults and pregnancy
The standard targets are not universal. The time-in-range consensus (opens in new tab) sets looser goals where lows are more dangerous, and a tighter band in pregnancy:
- Older or high-risk adults: time in range above 50% (more than 12 hours a day), time under 70 mg/dL below 1%, and time over 250 mg/dL below 10%. The ADA applies these goals to older adults with complex or intermediate health.
- Pregnancy with type 1 diabetes: a narrower band of 63–140 mg/dL (3.5–7.8 mmol/L), with more than 70% of the time inside it, because glucose levels are physiologically lower during pregnancy. The consensus notes that these pregnancy percentages rest on limited evidence.
The consensus also notes that for people under 25 whose A1C goal is 7.5%, a TIR target of about 60% is appropriate. Which set applies to you is a conversation with your care team, not a table lookup.
How time in range relates to A1C
Time in range and A1C track each other closely enough to translate roughly between them. In the consensus paper’s (opens in new tab) analysis of four randomized trials covering 545 adults with type 1 diabetes, a TIR of 70% corresponded with an A1C of about 7%, and a TIR of 50% with an A1C of about 8%. An increase in TIR of 10 percentage points — about 2.4 hours a day — corresponded to a decrease in A1C of about 0.5%.
The ADA’s 2026 Standards of Care (opens in new tab) set the two goals side by side: an A1C under 7% (for people without severe lows) and a time in range above 70% are each presented as appropriate for many nonpregnant adults, and, citing two retrospective studies, the ADA notes that a TIR goal of more than 70% aligns with an A1C of about 7%.
The relationship is a population pattern, not a conversion formula for one person. Two people with the same TIR can have different A1Cs, which is exactly why neither number retires the other. For what the A1C test itself measures, see our explainer on what an A1C is.
The time-in-range consensus (opens in new tab) adds one more useful fact for anyone watching the trend: each 5% increase in TIR is associated with clinically significant benefits. Small moves count — going from 60% to 65% of the day, say, is one of those steps.
How much data a time-in-range number needs
A time-in-range figure is only meaningful when there is enough data behind it. The time-in-range consensus (opens in new tab) recommends 14 days of CGM data with the sensor active at least 70% of that time, because that much data correlates strongly with three months of mean glucose, time in ranges and hyperglycemia.
In practice: a TIR computed from a sensor you wore for four days, or one that dropped out half the time, is a snapshot, not a verdict.
Can you calculate time in range with a finger-stick meter?
Not exactly, and it is worth being honest about why. Time in range is defined on continuous data — a reading every few minutes, around the clock. A meter gives you a handful of readings a day, taken at moments you chose. Counting how many of them fall in range gives you a percent of readings in range, which is a cousin of TIR rather than the same number:
- Your readings cluster. If most of your checks are fasting or before meals, a log over-represents those moments and under-represents the two hours after eating and the middle of the night.
- You test when something feels off. A reading taken because you felt shaky is more likely to be out of range than a random moment, which skews the count.
- Meter targets are per-moment, not one band. The ADA’s finger-stick goals (opens in new tab) for many nonpregnant adults are 80–130 mg/dL before meals and under 180 mg/dL at the after-meal peak — two different ranges, not the single 70–180 band a CGM report uses.
The idea is not CGM-only, though. The consensus paper (opens in new tab) cites an analysis of the seven-point finger-stick profiles collected in the landmark Diabetes Control and Complications Trial that found time in the 70–180 range correlated with diabetes complications. Structured readings spread across the day carry real information.
So a meter log’s percent in range is worth keeping, on three conditions:
- Log the context with every reading — fasting, before a meal, after a meal, bedtime. A number without its context cannot be flagged against the right target.
- Read it by context, not as one blended figure. A fine fasting average next to high after-meal numbers is a pattern; a single blended percentage hides it.
- Compare it with itself over time, not with a CGM’s TIR. Your March percent against your May percent is a trend. Your meter percent against a published CGM goal is apples to oranges.
That is how the Blood-Sugar / Diabetes Log is built: each reading is flagged against the before-meal, after-meal or bedtime range you entered, the dashboard splits before- and after-meal readings, and the percent in range reads from your targets rather than a generic rule. If you just want to start writing numbers down, the free one-page glucose log is a printable version for the fridge or a bag.
What to do with your time-in-range number
A time-in-range figure is most useful as a line, not a dot. Here is how to put it to work without turning it into a daily grade:
- Look at time below range first. The targets are strictest there for a reason, and a report with a good TIR and a creeping under-70 figure is not a good report.
- Track it next to your A1C history. Keeping each lab A1C beside your recent TIR or percent in range shows whether the two are moving together — and if they disagree, that is worth raising.
- Bring it to appointments as a page, not a memory. “My sugars have been okay” is not something a care team can act on. A two-week report, or a one-page summary computed from your log, is.
- Watch the direction. Per the consensus, each 5% increase in TIR is associated with clinically significant benefits — going from 60% to 65%, say, counts. You do not need to hit 70% this month to be making progress.
What to change in response to a number — food, activity, medication — is a decision for you and your care team. The log’s job is to make that conversation specific.
Common Questions About Time in Range
Is time in range better than A1C?
Neither replaces the other. A1C is a lab average over roughly the past two to three months; time in range shows how the hours were actually spent, including the lows an average hides. The ADA Standards of Care (opens in new tab) list both as ways to assess glycemic status.
What is a good time in range?
For many nonpregnant adults, the published goal is more than 70% of the time between 70 and 180 mg/dL, with less than 4% below 70 and less than 1% below 54. For older or high-risk adults the published goal is more than 50%. Your own target is set with your care team.
Does time in range apply to type 2 diabetes?
Yes. The 2019 international consensus set the same core targets for adults with type 1 and type 2 diabetes, with separate targets for older or high-risk adults and for pregnancy.
Can I get my time in range without a CGM?
Not the true metric, which is defined on continuous sensor data. A meter log gives you a percent of readings in range, which is a useful trend line of its own as long as you read it by context and compare it only with itself.
Where to keep your glucose and A1C records
If you wear a CGM, its app already computes your time in range, and you do not need a spreadsheet for that. What an app may not do is hold years of lab A1Cs, your targets and your appointment notes in one file you control. If you test with a meter, the log is where your percent in range comes from in the first place. (For the full trade-off, see spreadsheet vs. diabetes app.)
Either way, the Blood-Sugar / Diabetes Log keeps your readings, your targets, your A1C history and a one-page appointment summary together, in Excel or Google Sheets, in a file that is yours rather than an account you rent. Pair it with the Medication & Appointment Tracker to keep the rest of the routine in the same place. For a broader look at which at-home numbers are worth keeping at all, see home health tracking vs. an annual checkup.