The formula, and the two versions of it
Debt-to-income is deliberately simple. The complications are all in what counts.
- DTI = total monthly debt payments ÷ gross monthly income. Gross means before tax, before retirement contributions, before health premiums — the number on the offer letter, not the number in the account.
- Back-end DTI is the one people usually mean: the housing payment plus every other required monthly payment, over gross income.
- Front-end DTI is housing alone over gross income. Some lenders check it separately as well as the back-end ratio. It is the 28 in the old "28/36" rule of thumb — worth knowing, because 28% gets quoted so often that people mistake it for a whole-budget figure.
Take an illustrative household — invented for this page, with round numbers chosen to be easy to follow. It earns $8,250 a month gross, pays $741 a month in card, auto, student and medical minimums, and has an $1,850 housing payment. Its back-end ratio is ($741 + $1,850) ÷ $8,250 = 31.4%. Every figure worked through below belongs to that same imaginary household.
What counts as debt in a debt-to-income ratio — and what doesn't
This is where most people's estimate of their own ratio goes wrong. A lender counts the contractual monthly obligations that appear on your credit report, plus the full housing cost of the thing you are buying — and almost nothing else. The specifics below follow Fannie Mae's Selling Guide, which governs conventional conforming mortgages; other loan programs and other kinds of lending vary.
- Counts: credit card minimums on balances you carry, auto loans and leases, student loans (including ones in deferment), personal loans, medical financing, and court-ordered payments like child support or alimony. Fannie Mae B3-6-05 sets out how each is calculated — including one distinction worth knowing if your car is nearly paid off: an installment loan with ten or fewer payments left can usually be left out, while a lease counts however few payments remain.
- Also counts, on a mortgage: the whole housing payment on the home you're buying — not just principal and interest. Fannie Mae calls it PITIA, and it folds in property taxes, homeowners and mortgage insurance, and association dues.
- Doesn't count: utilities, groceries, upkeep and repairs, health and life insurance premiums, subscriptions, childcare, tuition you pay in cash, and money you send a family member.
One entry people routinely put on the wrong list: a credit card you clear in full every month. A charge card whose terms require payment in full is generally left out. An ordinary credit card is not — if it reports a balance, a payment gets counted against you whether or not you clear it, so what matters is paying it down before the statement closes rather than after.
Read that third list again, because it is the whole problem with treating a lender's answer as your answer. Childcare is not debt. It is also, for a lot of households, the largest line in the budget after housing. A ratio that ignores it is a good model of the lender's risk and a poor model of yours.
The debt-to-income thresholds people plan against
There is no single legal limit — caps vary by lender, loan program, credit profile, down payment, and the rest of your file, and they move over time. The bands below are the ones that get quoted most often. Treat them as planning conventions, not rules: they describe where a household tends to feel comfortable, not where any particular lender draws its line.
| Back-end DTI | What it usually signals |
|---|---|
| Up to about 28% | Comfortable by almost any standard, with room for a bad year. Note this column is the whole-budget ratio — 28% here is not the front-end 28 of the 28/36 rule above. |
| Around 36% | The long-standing conservative figure, and the one most planning advice still points at. It is also Fannie Mae's maximum for a manually underwritten loan, which can stretch to 45% where credit score and reserves support it. |
| Around 43% | The most-quoted "outer edge" number, and the one with a real origin: it was the debt-to-income limit in the CFPB's General Qualified Mortgage definition until a 2020 final rule replaced it with a price-based test. Approval is plausible; comfort is not. |
| Above 43% | Still lendable — Fannie Mae's automated underwriting allows up to 50%, so 43% is not the ceiling people assume. The margin that absorbs a job loss or a repair, however, has effectively gone. |
Confirm the figure that applies to you with your own lender. The point of the table is the shape, not the digits: the distance between the conservative figure and the outer edge is not spare capacity you are entitled to use. It is the buffer.
Want your own ratio and the price it leaves room for? The free Big-Purchase Affordability Estimator works both out — free spreadsheet, no signup.
Why one small payment costs so much purchase price
Debt-to-income sets a budget for a payment. To turn that into a price you divide by what one dollar of price costs you each month — the loan's payment factor applied to the financed share, plus the ownership costs. On a long-term loan that division is a large multiplier, and it runs in both directions.
Concretely, still on that imaginary household: at a 6.5% rate over 30 years with 10% down and ownership costs of 2.8% of the price a year, one dollar of price costs about $0.008022 a month. So $1 a month of existing payment removes roughly $125 of purchase price from your ceiling. Say one of its four debts is a card carrying a $4,200 balance at a $126 minimum: that single minimum is holding down about $15,700 of price — nearly four times the balance behind it. Change the rate, the term or the down payment and the multiplier changes with them.
That is the counter-intuitive part worth carrying away: your ceiling responds to what you pay each month, not to what you owe. It is also why clearing the smallest balance is often worth more than paying down the largest one.
The free estimator prices this lever directly: it reports what one dollar a month of payment is worth in purchase price on your own numbers.
When clearing a debt lowers your ceiling instead of raising it
Clearing a debt to raise your ratio only helps if debt-to-income is what is actually limiting you. If the thing stopping you is cash — the down payment and closing costs you can reach without emptying your emergency fund — then paying a balance off with money that would have been your down payment lowers your ceiling rather than raising it. You spent the cash that had to reach the closing table to free up a payment you had headroom for anyway.
Which is why knowing your ratio is only half the job. The other half is knowing whether it is the constraint that actually binds — the difference between what a lender will approve and what you can sustain.
How to improve your debt-to-income ratio before you apply
- Clear a small balance outright rather than paying a little extra on everything. The ratio responds to payments disappearing, not to balances shrinking.
- Don't open anything new. A financed sofa or a new card in the months before an application adds a payment to the stack at the worst possible time.
- Document income you actually have. Bonus, commission and self-employment income usually need a documented history — commonly two years — before a lender will count it, so it may be real to you and invisible to them.
- Ask what figure they'll use on a deferred loan. A student loan in deferment still counts, but not necessarily at the payment you expect: Fannie Mae's rules let a lender use 1% of the balance where no payment is documented, which can be higher than the real one — while a documented $0 income-driven payment can be used as $0. Get the number rather than assuming it.
What a good debt-to-income ratio still doesn't tell you
A comfortable debt-to-income ratio means the payment fits the income a lender can see. It says nothing about whether you can reach the closing table without spending your emergency fund, nothing about whether the purchase is a sensible size for what you earn, and nothing about the childcare, the commute, or the parent you help every month. Treat it as one of three tests, and the smallest of the three is your real answer.
The free Big-Purchase Affordability Estimator is a spreadsheet that runs this calculation for a home purchase — put in your income and your existing payments and it returns your ratio today and an estimated maximum price under the rate, term and cost assumptions you enter. It opens pre-filled with a worked example. No email, no signup.
This is a planning explainer, not lending advice
This page explains a term so you can plan with confidence. It is not financial, tax, or lending advice, it is not an offer of credit, and it is not a prediction that you will be approved for anything. The thresholds above are planning conventions rather than rules, and the underwriting specifics cited here come from Fannie Mae's Selling Guide for conventional conforming mortgages — your loan program, lender and file may all work differently. Every dollar figure on this page belongs to an invented household used to show the arithmetic. Confirm what applies to you with your own lender.
Templates that implement this
Work out your own ceiling
4 templates
A workbook that turns your debt-to-income headroom into an actual maximum purchase price — and checks it against two limits a lender's approval was never trying to set for you.
- $12.95 Spreadsheet

Big-Purchase Affordability Calculator — Your Ceiling Computed Three Ways, the Binding Constraint Named & Every Price Point Costed (Excel & Google Sheets)
Work out what you can actually afford before a house, car, wedding or renovation — your ceiling computed three ways, with the binding constraint named.
Big DecisionsView details - $14.95 Spreadsheet
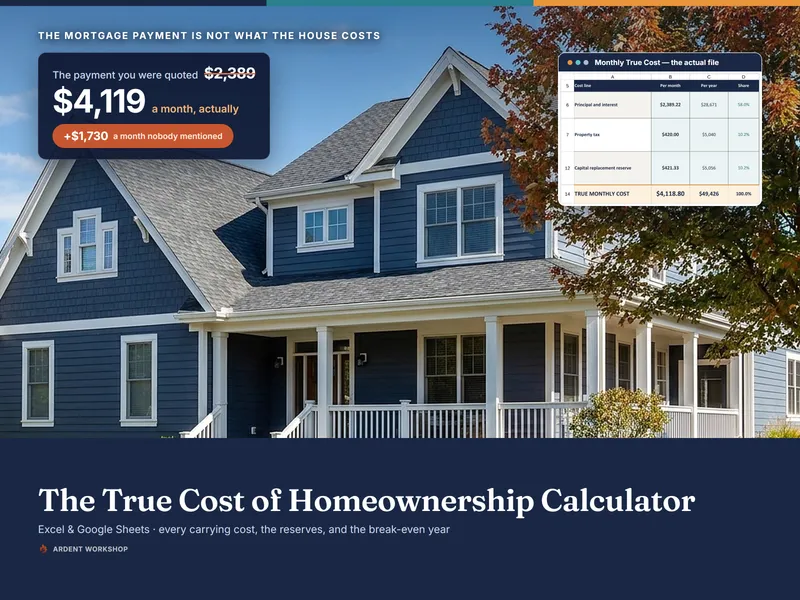
True Cost of Homeownership Calculator — Every Carrying Cost, the Replacement Reserves & the Buy-vs-Rent Break-Even Year (Excel & Google Sheets)
Find what a specific home really costs per month — the mortgage payment plus the seven lines listing sites leave out — and the year owning beats renting.
Big DecisionsView details - $14.95 Spreadsheet

Buy-vs-Rent (Home) Decision Helper - Break-Even Year, Readiness Gates & Weighted Scoring (Excel + Google Sheets)
Settle whether to buy or keep renting. Computes your break-even year, runs six readiness checks, and weights 16 criteria to your household.
Big DecisionsView details - $2.95 Excel
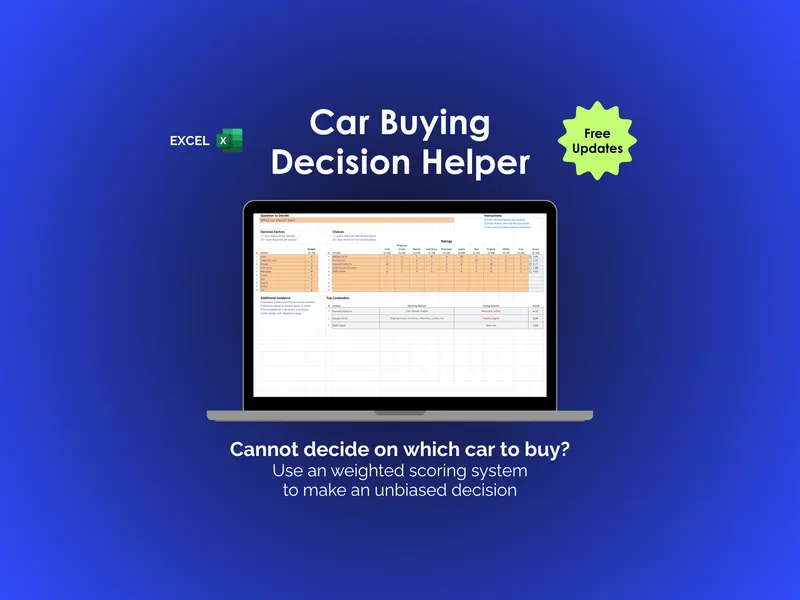
Car Buying Decision Helper - Excel
There are two kinds of car shoppers: the ones who score every option, and the ones who guess. This Excel car buying decision helper turns gut feel into weighted math.
Big DecisionsView details