Should you buy, or keep renting?
It is one of the most-researched money questions there is, and one of the worst-served. Search it and you get two things: rules of thumb built for a household that isn’t yours, and calculators built by people who get paid when you buy.
This is neither. It’s a structured way to settle the question for your household, on your numbers — with an honest willingness to answer “not yet.”
Most buy-or-rent tools have the same flaw
They give every household the same criteria at the same importance. But whether buying is right depends far less on the house than on the household: how long you’ll really stay, what cash stands behind you, how likely a move is, whether you’d enjoy the upkeep or resent it, how much staying put matters.
So the Your Situation tab asks ten questions and computes a suggested weight for every one of the sixteen criteria — showing you the reason each adjustment fired, in plain language. “+5 — buying would take very nearly all the cash you have.” Two households looking at the same house get different weights, because they should. Disagree with one? Change it. You know your household better than a formula does.
The number almost nobody calculates
Buying carries large one-time costs at both ends, so owning starts a long way behind and has to catch up. The year it catches up is your break-even year — and it decides more than anything else on the spreadsheet.
The workbook computes it from a year-by-year table you can read and check, built on one rule: both paths start with the same cash and are measured the same way. Year 0 is a real row, because buying and selling the same day must lose exactly the selling cost plus closing — and if it doesn’t, the model is wrong. Then it recomputes the whole thing under cautious and favorable assumptions, so you can see how much the answer actually moves. When those years land far apart, the money genuinely can’t settle this, and the workbook says so instead of handing you one confident number.
What owning really costs
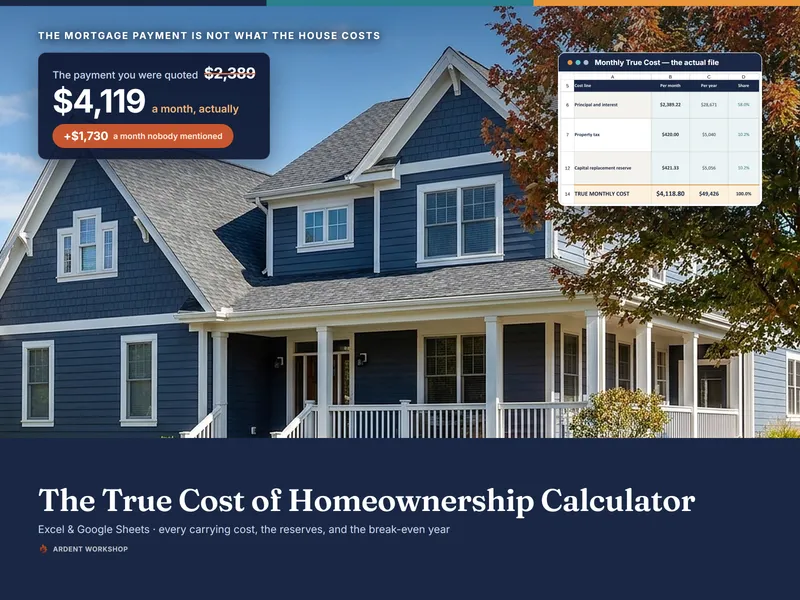
Not the mortgage payment. The all-in monthly figure: principal and interest plus property tax, insurance, any dues, a real maintenance reserve, and the utilities your landlord currently pays. In the worked example that’s $3,028 a month against a $2,068 payment — and $2,070 to rent.
It also makes you answer the assumption most calculators leave unnamed: owning costs more each month, so what does the renter do with the difference? Spend it, and buying overtakes renting in year 9. Invest it, and the crossing moves to year 13. Both are honest answers; the workbook makes you pick one rather than quietly picking for you.
Six checks that are allowed to say “not yet”
A mortgage calculator answers “how much could you borrow.” That’s a lender’s question, and the honest answer is almost always more than you should. The Readiness Gates answer the one you actually need — should you do this yet? — across your cash cushion after closing, your all-in housing ratio, total debt, stay horizon against break-even, maintenance reserve, and income stability.
Each returns PASS, CAUTION, or NOT YET with the specific thing that would move it. The thresholds are deliberately stricter than a lender’s, because a lender measures what you can be made to pay and this measures what you can comfortably live on. A gate at NOT YET isn’t a verdict against buying — it’s a verdict against buying right now, which is a much more fixable thing.
It tells you how fragile the answer is
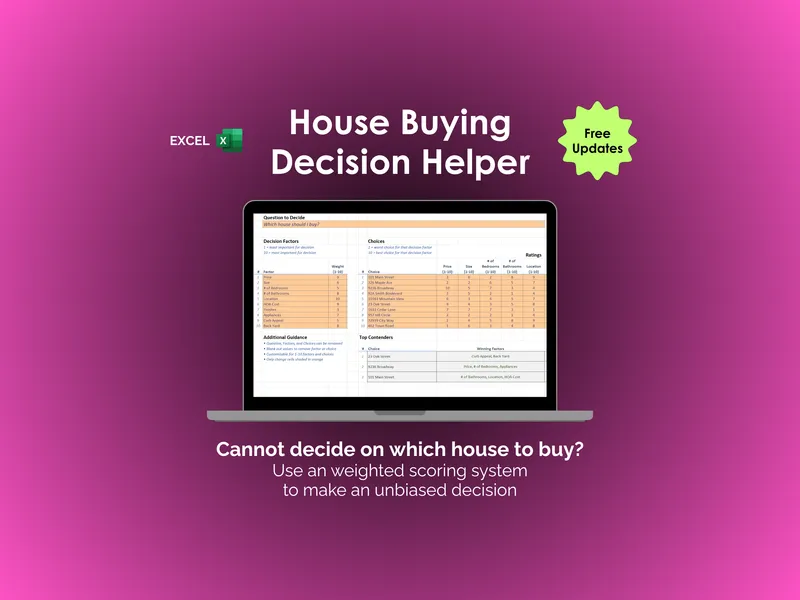
Two scores on the same 1-to-5 scale, and the margin between them. Under about a quarter of a point it says too close to call and means it — nobody rates a 1-to-5 scale finely enough for a hundredth of a point to decide where a household lives.
Then it does something almost no scoring tool does about its own output: it names the single row carrying the verdict, and tells you whether neutralizing that one row would reverse the answer. If it would, you find that out before you act on it.
Own it, don’t rent it
A blank spreadsheet makes you build all sixteen criteria, the amortization, and the thresholds yourself. A subscription app rents you someone else’s fixed criteria and keeps your numbers on their server. This is the middle rung: a designed, genuinely computed system you download once, keep forever, and open again when the rate moves or the plan changes.
Works in Excel, Google Sheets, and LibreOffice Calc — with a one-click “Make a copy” link for the native Google Sheet, so there’s nothing to import. It opens on a complete worked example, so you can watch the whole method run before typing a number of your own.
A decision aid — not advice
This is a decision-making and planning template, not financial, mortgage, legal, tax, or real-estate advice. The example household, the home, the rental, and all their figures are fictional and illustrative. The rates, growth assumptions, and gate thresholds are planning assumptions you can change — not forecasts, and not lending criteria. A lender runs its own tests on its own definitions and reaches its own answer; a gate passing here is not an approval. For a decision this size, an hour with a qualified professional is worth the fee. The decision, and the responsibility for it, stay yours.
Try it free first
Want to feel the method before you buy? The free Buy-vs-Rent Quick Check scores the two paths across seven core criteria, opens pre-filled with the same worked example, and needs no signup. It starts every household on the same fixed weights — the full workbook computes yours, and adds the break-even year, the readiness gates, and the flip point.
Already decided to buy, and want the deep cost model for one specific house? The True Cost of Homeownership Calculator is the companion to this one.