Ask three people whether to buy or keep renting and you will get three answers, each delivered with total confidence. The person who bought in 2012 says renting is throwing money away. The person who rents in an expensive city says buying is a trap. And whoever has a mortgage to sell you says now is a great time.
The price-to-rent ratio is the one number that cuts through that. It compares what a home costs to buy with what the same kind of home costs to rent, and it tells you in a few seconds which way your local market leans. It doesn’t settle the question by itself, though. A ratio that says “buy” can still be the wrong call for your household. The Buy-vs-Rent (Home) Decision Helper picks up where the ratio stops: it turns your actual price, rent, rate and stay length into a break-even year. The ratio comes first, though, and here is how to read it honestly, from both sides.
What Is the Price-to-Rent Ratio?
The price-to-rent ratio is the price of a home divided by one year of rent for a comparable home. It works the same way a price-to-earnings ratio works for a stock: it tells you how many years of “income” (here, the rent you would otherwise pay) the price represents.
The formula: price-to-rent ratio = home price ÷ (monthly rent × 12).
A worked example with illustrative numbers: a three-bedroom house is listed at $360,000, and three-bedroom houses on the same streets rent for $1,800 a month. A year of rent is $21,600, so the ratio is 360,000 ÷ 21,600 = 16.7. Buying costs roughly 16.7 years of rent.
A low ratio means homes are cheap relative to rents, which favors buying. A high ratio means homes are expensive relative to rents, which favors renting.
How to Calculate the Price-to-Rent Ratio for Your Area
The arithmetic is trivial. What you put into it is the hard part. The rule that matters most is compare like with like: the same size, the same type of home, in the same area.
- Pick the home you would actually buy. Use the price of a specific listing, or the recent sale prices of homes like it, not a citywide median.
- Find the rent for that same kind of home. Look up rentals with the same bedroom count and property type in the same neighborhood. A two-bedroom apartment’s rent tells you nothing about a three-bedroom house.
- Annualize the rent. Multiply the monthly rent by 12.
- Divide the price by the annual rent.
Here is why the like-for-like rule matters. Nationally, the Census Bureau’s 2019–2023 American Community Survey estimates (opens in new tab) put the median home value at $303,400 and median gross rent (rent plus utilities) at $1,348 a month. Divide them and you get about 18.8. That is a real calculation on real data, and it is still a misleading number. The median owned home is typically a different kind of building from the median rental, and gross rent includes utilities that a sale price doesn’t. A national ratio is a talking point. Your street’s ratio is a decision input.
| Input | Use | Avoid |
|---|---|---|
| Price | A real listing or recent sales of the home type you would buy | A citywide or national median |
| Rent | Current asking rent for the same bedroom count and property type, same area | Rent for a smaller unit, or your own below-market rent |
| Rent period | Monthly rent × 12 | Mixing a weekly or annual figure without converting |
| Location | One neighborhood or school zone | A whole metro that blends cheap and expensive areas |
What Is a Good Price-to-Rent Ratio?
A ratio of 15 or below is the conventional signal that buying is favorable, 16 to 20 is a gray zone that typically leans toward renting, and 21 or above is the conventional signal that renting is favorable. Those cut points come from SmartAsset’s price-to-rent ratio study of the 50 largest US cities (opens in new tab), which reads 1 to 15 as favoring buying, 16 to 20 as “typically” favoring renting, and 21 or more as favoring renting. “Gray zone” is our shorthand for that middle band, because it is where the answer depends most on your own situation.
| Ratio | Conventional reading | What it means in years of rent |
|---|---|---|
| 15 or below | Buying is favorable | The home costs 15 years of rent or less |
| 16 to 20 | Gray zone, leans toward renting | Buying can still make sense for a long stay |
| 21 or above | Renting is favorable | The home costs more than 20 years of rent |
The spread between markets is enormous. In that same 2022 study, which used data from March 2021 through February 2022, Detroit came in at 5.82 and San Jose at 42.16. The same household with the same income faces a completely different question in those two cities. That is the ratio’s real strength: it tells you which question you are actually asking.
The Case for Trusting the Price-to-Rent Ratio
On one hand, the price-to-rent ratio does something no other quick check does. It anchors the buy decision to the alternative you actually have. You are never choosing between buying and nothing. You are choosing between buying and renting a comparable home, and the ratio puts both in one number.
It is also hard to fool yourself with. A listing’s monthly payment can be made to look small with a long loan term or a low teaser rate. A ratio of 28 is 28 whatever the loan looks like. And it travels well: you can compare two neighborhoods, two cities or two moments in time in seconds, which no full spreadsheet model lets you do.
If your local ratio sits far below 15, buying is likely to beat renting for anyone staying more than a few years, though how far below depends on your mortgage rate (more on that next). If it sits at 35, the burden of proof is entirely on buying. At the extremes, the ratio is usually right.
The Case Against It: Why the Ratio Can Lie
On the other hand, the ratio leaves out the two things that most change what a house really costs you: the mortgage rate and how long you stay.
This isn’t a fringe objection. In their paper Assessing High House Prices: Bubbles, Fundamentals, and Misperceptions (opens in new tab), economists Charles Himmelberg, Christopher Mayer and Todd Sinai argue that conventional metrics including the price-to-rent ratio “can be misleading because they fail to account both for the time series pattern of real long-term interest rates and predictable differences in the long-run growth rates of house prices across local markets.”
In plain terms:
- Rates change what a ratio means. The ratio only sees the price. A buyer at 4.5% and a buyer at 6.5% pay the same price for the same house, and very different amounts to hold it.
- Some markets reliably appreciate faster than others. A high ratio in a city whose prices have long grown faster than average is not the same warning as a high ratio somewhere flat.
- It ignores everything else that costs money. Property tax, insurance, maintenance, closing costs on the way in, selling costs on the way out, and the return your down payment would have earned elsewhere all sit outside the ratio.
- It ignores your timeline. Buying and selling costs are paid once, so the shorter you stay, the more each year has to absorb.
Here is the rate problem in numbers. Take the illustrative $360,000 house from earlier (ratio 16.7), bought with 20% down. Count only the costs you never get back in the first year: mortgage interest, about 1% of the price in property tax, about 1% in maintenance, $1,800 of insurance, and a 4% return given up on the $72,000 down payment.
| Cost line | Mortgage at 4.5% | Mortgage at 6.5% |
|---|---|---|
| First-year mortgage interest | $12,865 | $18,625 |
| Property tax, maintenance, insurance | $9,000 | $9,000 |
| Return given up on the down payment | $2,880 | $2,880 |
| Unrecoverable cost per month | about $2,060 | about $2,540 |
| Rent for the same house | $1,800 | $1,800 |
Principal paydown and appreciation are left out of the table because the owner gets them back.
Same house, same ratio, and nearly $480 a month of difference from the rate alone. In this example, owning’s unrecoverable cost runs to about 6.9% of the price a year at 4.5% and about 8.5% at 6.5%. Put another way, rent would only match it at a ratio of roughly 14.5 at the lower rate and roughly 11.8 at the higher one. The fixed line at 15 quietly moves when rates do.
What the table leaves out is the owner’s offset: appreciation. If the house gains value, that gain sits on the owner’s side alone, and over a long enough stay it can more than cover the gap. That is exactly why the stay length matters so much, and it is the one thing the ratio can’t see.
Price-to-Rent Ratio, Mortgage Rate and Stay Length Together
Put the two cases together and the real dividing line isn’t the ratio alone. It’s the ratio, plus your mortgage rate, plus how many years you will stay.
- Low ratio (15 or below): buying usually wins once you clear your buying and selling costs, often within a few years. The question is mostly whether you are ready, not whether buying pays.
- Gray zone (16 to 20): it comes down to rate and stay length. A long stay and a reasonable rate can carry a buy at 18. A likely move in three years usually can’t.
- High ratio (21 or above): renting is the default. Buying needs a long horizon, strong expected appreciation or a reason that isn’t financial, such as stability for a child’s schooling or wanting to change the house itself.
The number that answers the question for your household is the break-even year: the year in which owning has cost you less, net of everything, than renting would have. Every input the ratio leaves out, including rate, taxes, maintenance, transaction costs and appreciation, goes into finding that year. If you will move before it arrives, rent. If you will stay well past it, buying is on solid ground.
If you are already past the ratio and asking the wider question, the framework in should I buy a house in 2026 covers the household side: savings, job stability and how settled you really are. And before any showing, run the five checks for how much house you can afford.
The Verdict: A Screen, Not an Answer
Use the price-to-rent ratio as a screen, never as the answer. It is the fastest honest read on whether your market favors buying or renting, and at the extremes it is usually right. Far above 20, renting wins for most households that might move. Far below 15, buying usually wins for households that stay put, but the worked example above shows how low “far below” has to be when rates are high: at 6.5%, rent only matched owning’s unrecoverable cost at a ratio of about 11.8.
In between, which is where most households in most cities actually live, the ratio only tells you that the decision is close. Close decisions are settled by your rate, your stay length and your cash, so calculate the ratio, see which band you are in, and then do the full math for your own situation.
Common Questions About the Price-to-Rent Ratio
What is a good price-to-rent ratio?
A ratio of 15 or below is the conventional signal that buying is favorable, 16 to 20 is a gray zone that typically leans toward renting, and 21 or above is the conventional signal that renting is favorable.
Is a price-to-rent ratio of 20 good for buying?
Not on its own. At 20, a year of rent is only 5% of the price, and the unrecoverable costs of owning — interest, property tax, maintenance, insurance and the return your down payment gives up — can easily run higher than that. In an illustrative $360,000 purchase with 20% down, they come to about 6.9% of the price a year at a 4.5% mortgage rate and about 8.5% at 6.5%. Buying at 20 depends on staying long enough for appreciation and principal paydown to make up the difference.
Does the price-to-rent ratio include mortgage rates?
No. The ratio uses only the price and the rent, so the same ratio can mean a good deal at a low mortgage rate and a poor one at a high rate. That is the main reason to treat it as a screen rather than a verdict.
Do the Full Math for Your Household
The ratio tells you which way the market leans. The Buy-vs-Rent (Home) Decision Helper tells you which way your household should go. It builds a year-by-year table to find your break-even year, re-runs it under cautious and favorable assumptions, and checks six readiness gates that answer “should we buy yet,” not “how much could we borrow.” It also weights 16 criteria to how you actually live, so a likely job move or a love of DIY counts for what it should. It’s a workbook you keep and re-run whenever the rate or the listing changes, not a calculator built by someone who earns a commission when you buy.
Not ready for the full workbook? The free Buy-vs-Rent Quick Check scores buying against renting on the seven things that matter most, with no signup.
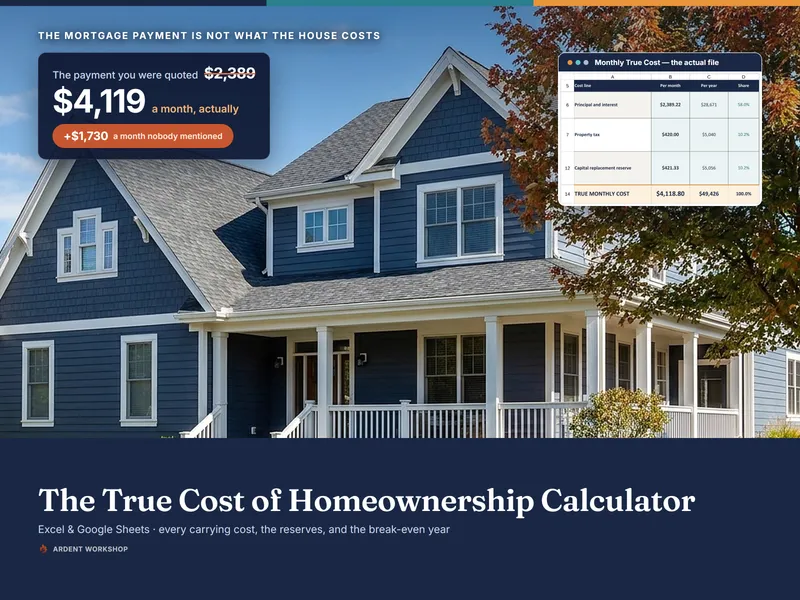
If buying wins, the True Cost of Homeownership Calculator puts a monthly number on everything the listing leaves out.