How to measure it
- Measure first thing in the morning, before getting out of bed. After you've moved around, the number reflects exertion, not rest.
- Lie still for two minutes. Don't talk, don't reach for the phone.
- Find your pulse — wrist (radial) or neck (carotid). Count for 60 seconds, or count for 15 seconds and multiply by four.
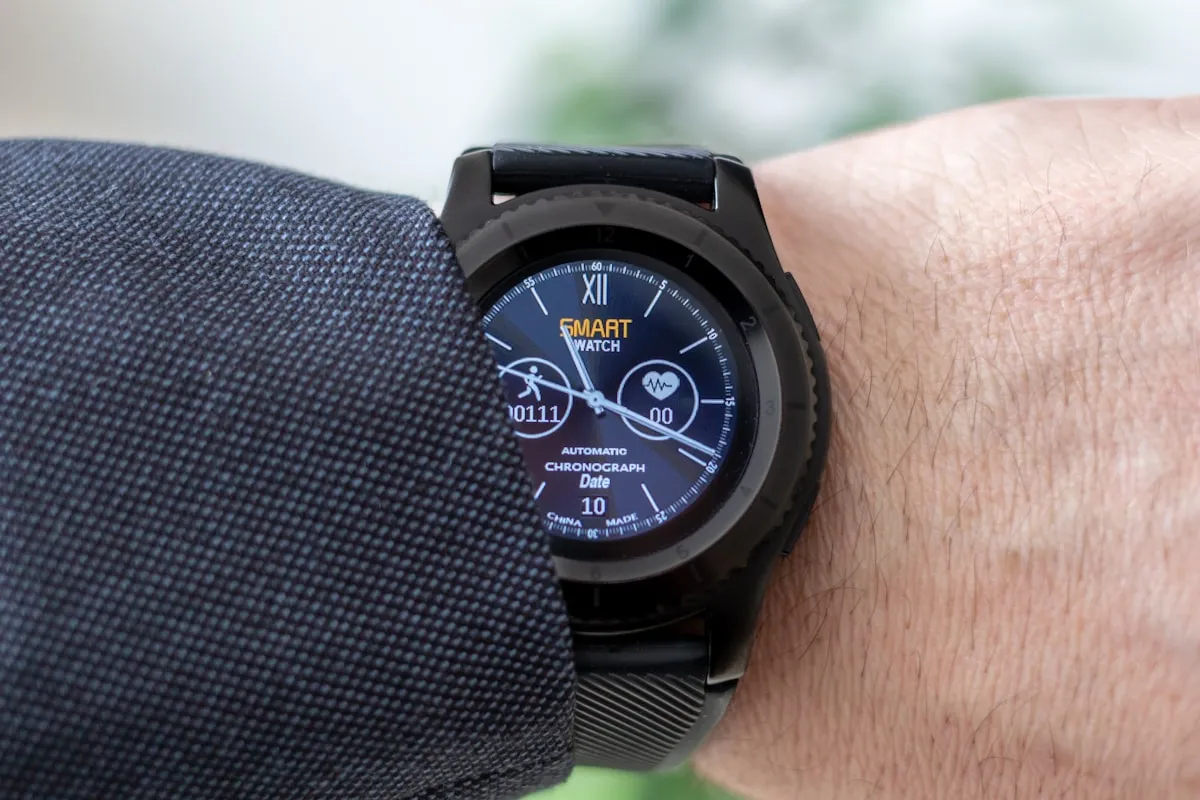
- Record it. A wearable device works too, but the manual method is the truth-source if a reading looks off.
For trend tracking, the same time of day in the same conditions is more important than absolute precision. A reading on Monday morning at 7am is comparable to Tuesday morning at 7am — not to Tuesday evening after coffee.
Typical ranges and what affects them
For most healthy adults, resting heart rate falls between roughly 60 and 100 beats per minute. Trained endurance athletes often run much lower — frequently in the 40s or 50s — because a stronger heart moves more blood per beat and needs fewer beats to do the same work. Children and infants run higher. Your own baseline is more useful than these ranges; a 75 might be normal for you and a warning sign for the person next to you.
Things that move resting heart rate (sometimes by 10–20 bpm) include:
- Sleep quality. Poor sleep raises RHR the next morning. A clean trend line will show this within days.
- Hydration. Dehydration makes the heart work harder to maintain blood pressure.
- Caffeine and stimulants. Even the cup of coffee 12 hours ago can leave a residue.
- Stress. Sustained psychological stress shifts the baseline upward.
- Illness. RHR commonly spikes 5–10 bpm a day or two before you feel symptoms. Athletes use this as an early-warning signal.
- Fitness. Over weeks of consistent aerobic training, RHR drifts down. That's the most common positive trend.
- Alcohol. Raises RHR the morning after, even with modest amounts.
- Medication. Many common medications change heart rate. Beta blockers lower it deliberately.
What a trend actually tells you
A single reading is noise. A trend is signal. Logging your RHR daily for two to four weeks gives you a personal baseline. From there:
- A steady decline over months usually reflects improving cardiovascular fitness.
- A sudden spike of 5–10 bpm above baseline that lasts more than a couple of days is often the first sign of illness, overtraining, or poor sleep cycles.
- A steady drift upward over weeks can correlate with chronic stress, weight gain, deconditioning, or new medication.
- A sharply elevated reading at rest (consistently above 100 bpm at rest, called tachycardia) is something to flag to a clinician.
Why people log it themselves
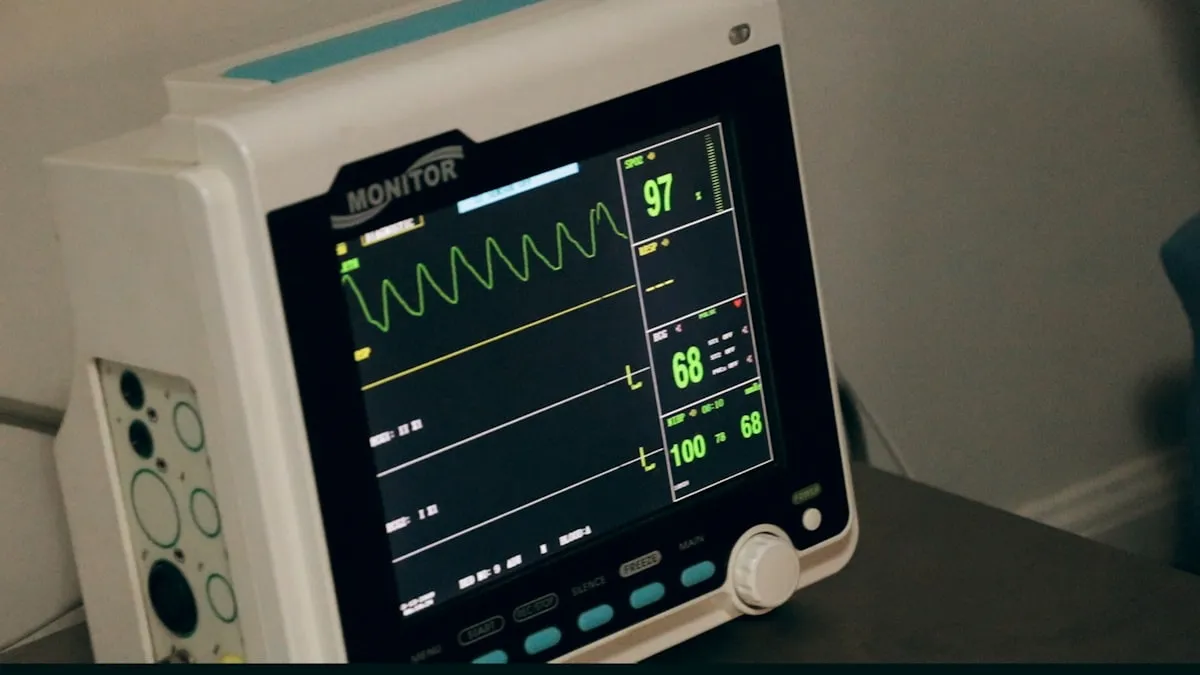
Smartwatches and fitness rings give continuous heart-rate data, which is genuinely useful. But the manual log adds two things the wearable doesn't: an explicit context column (sleep, illness, alcohol, stress) and your own narrative. A spreadsheet that pairs the morning reading with "slept 5 hours, two glasses of wine" is more diagnostic than a chart showing the number alone.
A manual log also survives leaving the device ecosystem. Numbers logged in a personal spreadsheet are yours forever, in a format no app subscription can hold hostage.
Common mistakes
- Measuring after activity. Walking to the bathroom and back is enough to elevate the reading.
- Comparing to population averages. Your trend against your baseline is the useful comparison.
- Reacting to single readings. Wait for a pattern. Two consecutive elevated mornings is worth noting; one isn't.
- Ignoring the context column. Without notes, the chart just shows numbers. With notes, it shows cause and effect.
This page is general information, not medical advice. A persistently elevated, depressed, or irregular resting heart rate is a reason to talk to a clinician, not to a spreadsheet.
Related templates and concepts
Resting heart rate is one of several vital signs people log at home — see also what is blood pressure for the companion metric most often tracked alongside it.
Templates that implement this
Templates that track resting heart rate
3 templates
Log readings over time, watch trends in a dashboard, and compare AM and PM patterns — without giving a wearable's app your data.
- $4.95 Excel
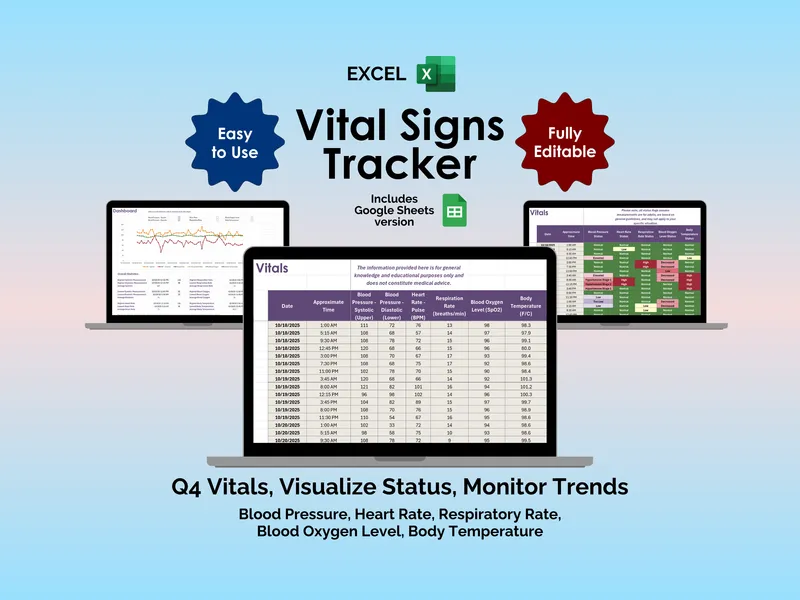
Vital Signs Tracker - Excel
Nobody warns you how loud a quiet number can feel. This excel vital signs tracker logs blood pressure, heart rate, SpO2, and temperature in one steady place.
Life AdminView details - $4.95 Sheets
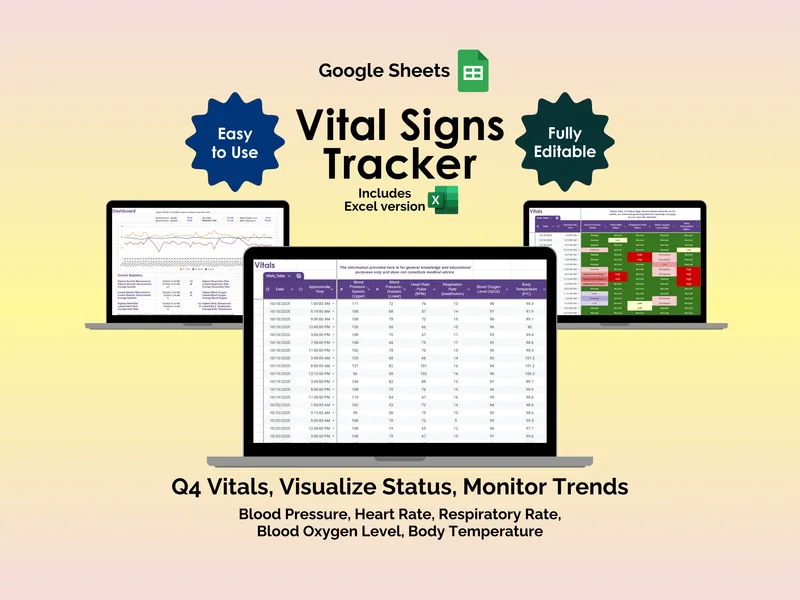
Vital Signs Tracker - Google Sheets
Home health logs fail at the same point every time: trends. This google sheets vital signs tracker turns scattered readings into a dashboard with status flags and clear ranges.
Life AdminView details - $3.95 Excel
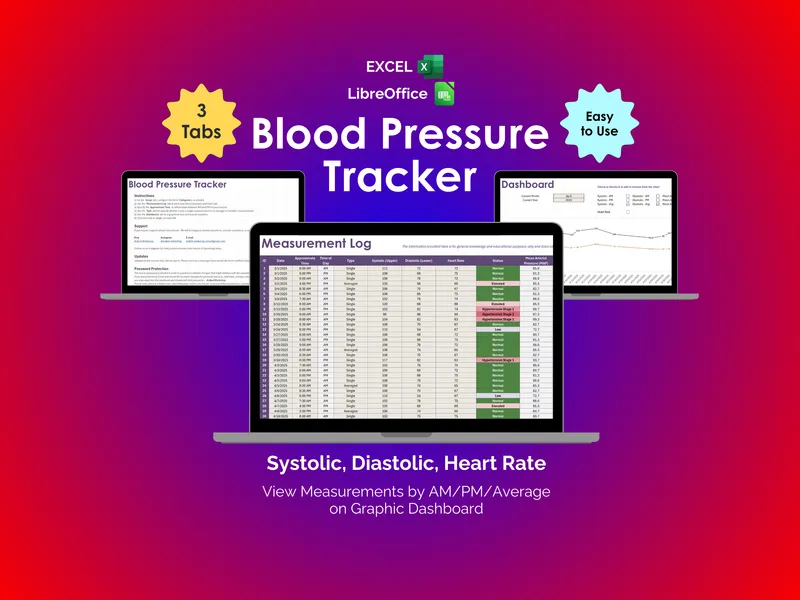
Blood Pressure Tracker - Excel
A single cuff reading rarely tells you what's actually happening. An Excel blood pressure tracker that logs systolic, diastolic, and heart rate as a pattern over time. Excel and LibreOffice files are both in the download.
Life AdminView details