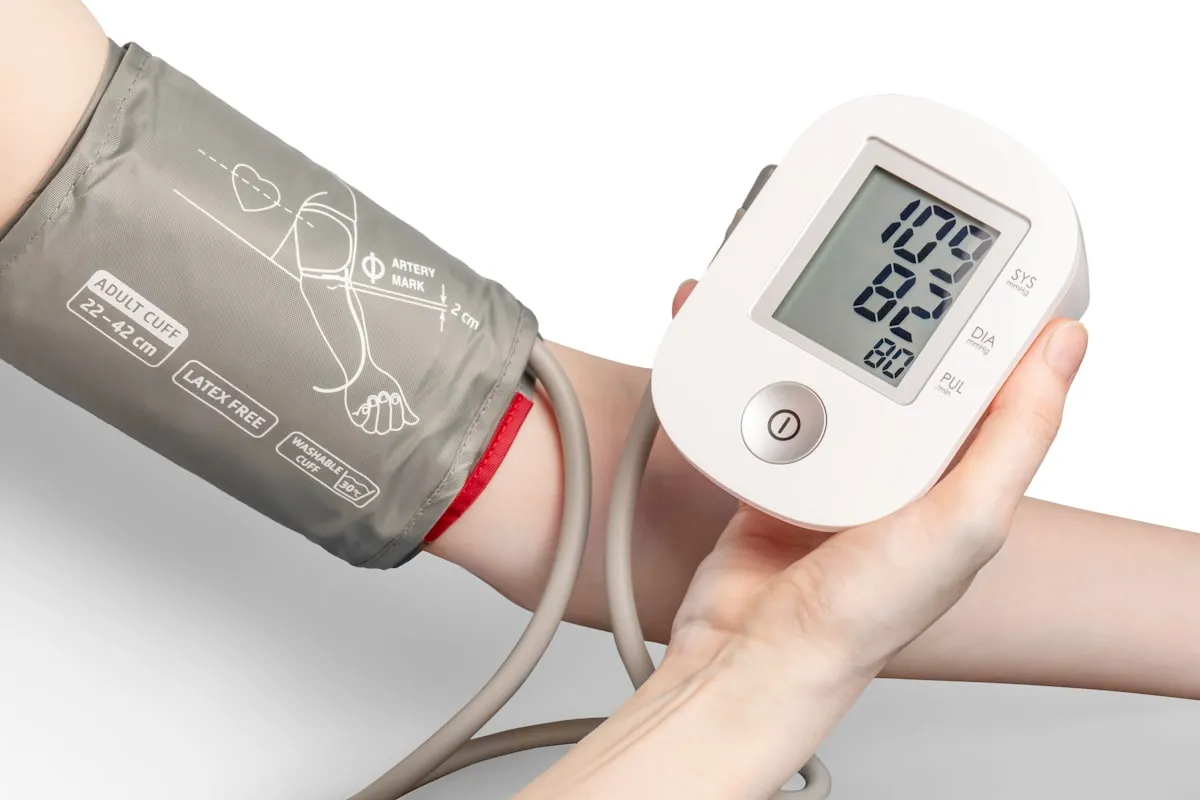
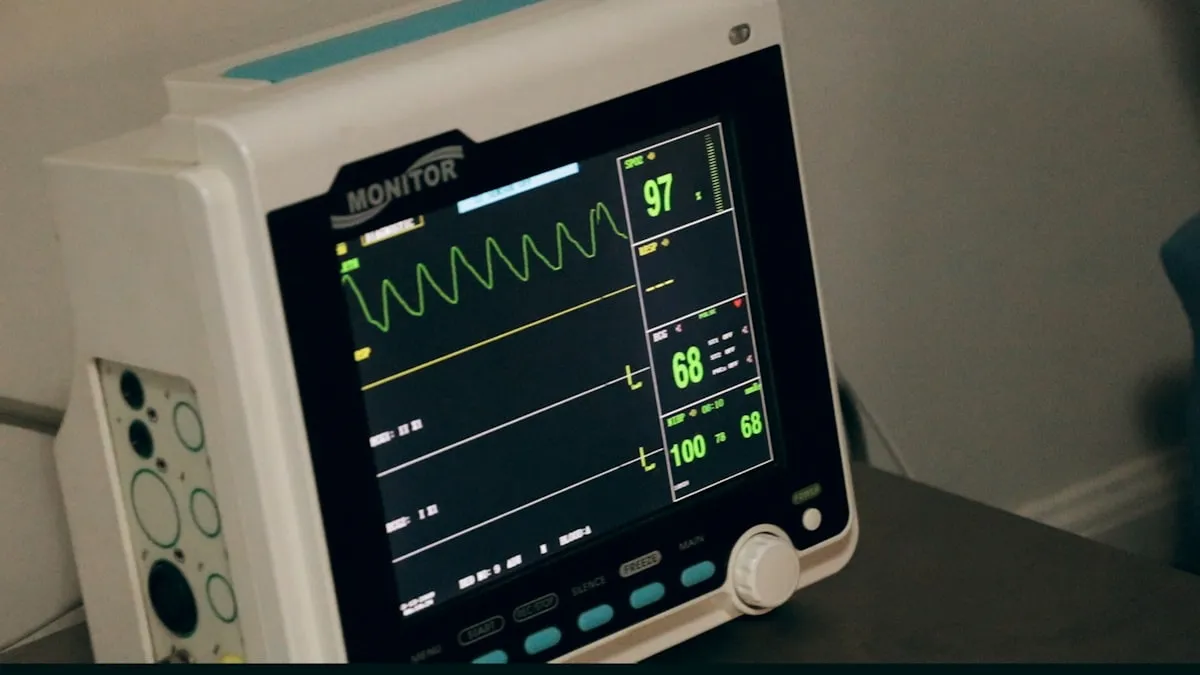
A single number on a cuff display rarely tells you what’s actually happening with your blood pressure. This Excel blood pressure tracker is a quiet, private spreadsheet for anyone who has been asked by a doctor to monitor readings at home, or who simply wants a clearer view of their cardiovascular health. It runs in both Microsoft Excel and LibreOffice, so there is no subscription and no account to create.
The blood pressure log spreadsheet is organized into three tabs. The Instructions tab walks through setup at your own pace, and the workbook is fully editable, so the layout stays clear while you remain free to customize what you need. If a number on the page feels heavy on a given day, the structure is designed to hold it without judgment.
The Measurement Log is where each reading lives. You enter the Date, Time, and Type (AM or PM), then the Systolic, Diastolic, and Heart Rate values from your monitor. The sheet handles up to 1000 measurements and automatically labels each row in the Status column as Normal, Low, or High, with color-coded cells so the trend is visible at a glance. A Mean Arterial Pressure column is calculated for you, which is often a useful figure to share with a clinician.
The Dashboard tab is where the excel blood pressure tracker becomes a longer story instead of a snapshot. A line chart plots your readings over time, and checkboxes let you selectively show or hide Systolic AM, Systolic PM, Systolic Avg, Diastolic AM, Diastolic PM, Diastolic Avg, and the same three views for Heart Rate. Summary tiles show Highest and Latest Systolic and Diastolic measurements, Average Systolic, Average Diastolic, Average MAP, and the total number of readings.
What sets this blood pressure log spreadsheet apart from a paper notebook or a free phone app is the ability to compare AM to PM to Average side by side, on your own machine, in a file you own. Many people are told their numbers shift during the day, and seeing that pattern with your own data can take some of the abstraction out of the conversation with a healthcare provider.
You can use this tracker for yourself or print and share the dashboard view at an appointment. It is a small, calm tool for a topic that rarely feels small. The hope is that having your readings organized in one place makes the next check-in feel a little less uncertain.