Retirement is a question that gets carried for decades without ever earning a real answer. There’s a vague projection from an advisor years ago, a 401k statement that arrives quarterly, an IRA balance you check when you remember, and a hazy sense of Social Security somewhere down the road. The pieces never quite assemble into a picture, and the worry quietly compounds along with everything else.
The weight of that uncertainty is real, and it deserves more than a single number from an online calculator. This excel retirement planner was built to give the full picture in one place — your savings, your spouse’s savings, your contributions, your future income, your projected expenses, and the year-by-year arc connecting them all. It’s a retirement planning spreadsheet you own outright, with no account to create and no financial data shared with anyone.
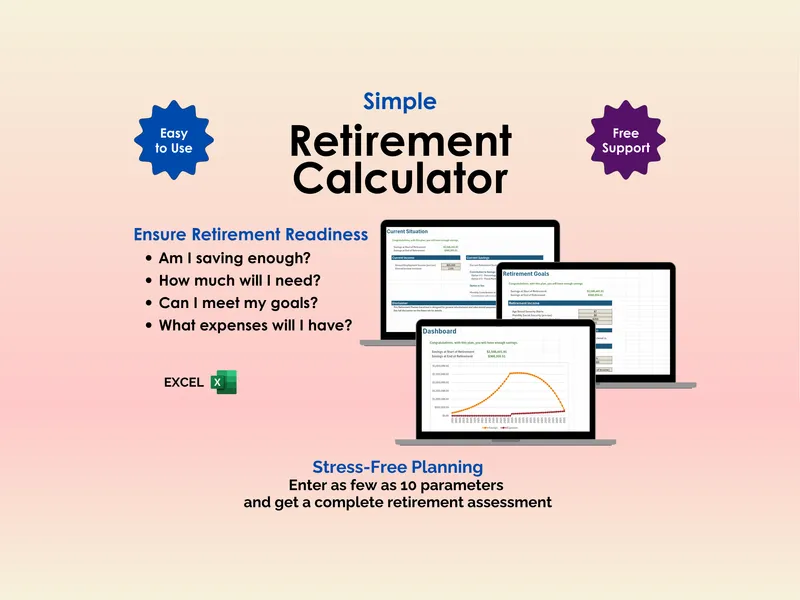
The Setup sheet holds the assumptions that quietly shape everything: retirement age, life expectancy, inflation rate, and expected return rates for the years before and after retirement. Suggested defaults are already filled in, so the blank-page paralysis vanishes. Adjust a single cell to see a more conservative return rate, an earlier retirement, or a longer life expectancy, and the rest of the planner recalculates around it.
The Current Situation sheet captures where things actually stand today — current income, existing savings, and ongoing contributions, with separate profiles for you and a spouse. Contributions can be entered as a percentage of income or a fixed dollar amount, and the planner automatically applies annual income increases and inflation across the timeline. The fragmented mental math vanishes; the combined household view stays.
The Retirement Goals sheet handles the other side of the equation. Income during retirement from Social Security and pension sources sits alongside a detailed retirement budget covering housing, healthcare, travel, and other categories. Multiple options are available for calculating retirement expenses, so a rough first pass and a line-item budget are both supported within the same excel retirement planner.
The Dashboard brings it together with savings at the start of retirement, savings at the end, and a dynamic chart of savings and expenses plotted across every year of the plan. The vague projection vanishes, replaced by a curve that responds the moment any input changes. The Detail tab lays out the full year-by-year calculations behind that curve, so every figure remains traceable rather than hidden inside a formula.
What separates this from a one-number calculator is ownership and transparency: it includes both Excel and Google Sheets versions, works offline, and keeps every assumption visible and editable. The uncertainty doesn’t disappear because life rarely cooperates with a spreadsheet, but the fog around the numbers does, and that’s often where the real anxiety lives.