Retirement planning, including the FIRE variant, comes down to one honest first question: does the math actually work? This excel retirement calculator is built for that question. Ten inputs, a few minutes, and a clear projection of your savings against your expenses through the end of retirement.
The retirement planning spreadsheet starts on the Setup sheet, where you fix the ground rules: birth year, planned retirement age, life expectancy, inflation rate, and separate return rates for the years before and after retirement. Suggested defaults are included so the model produces results immediately, and each cell is a single edit away from a different scenario. The point of this sheet is to make your assumptions visible rather than buried in a formula.
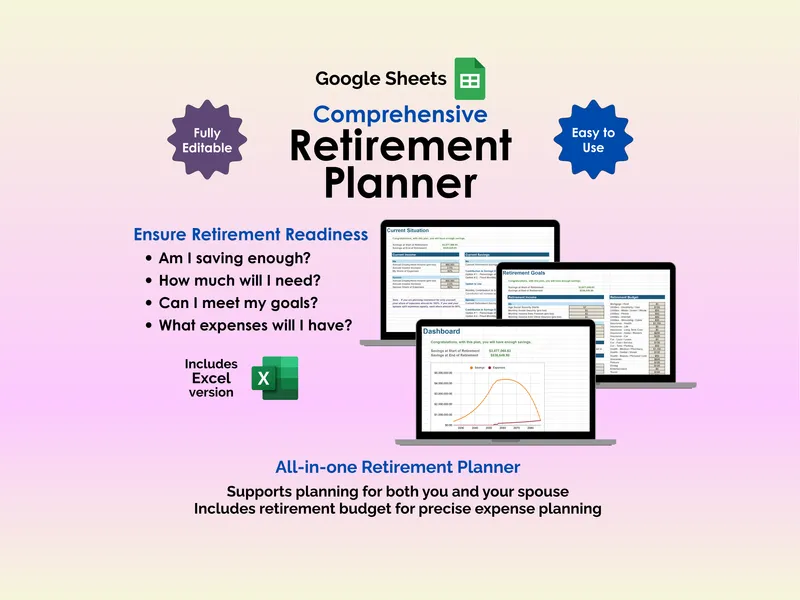
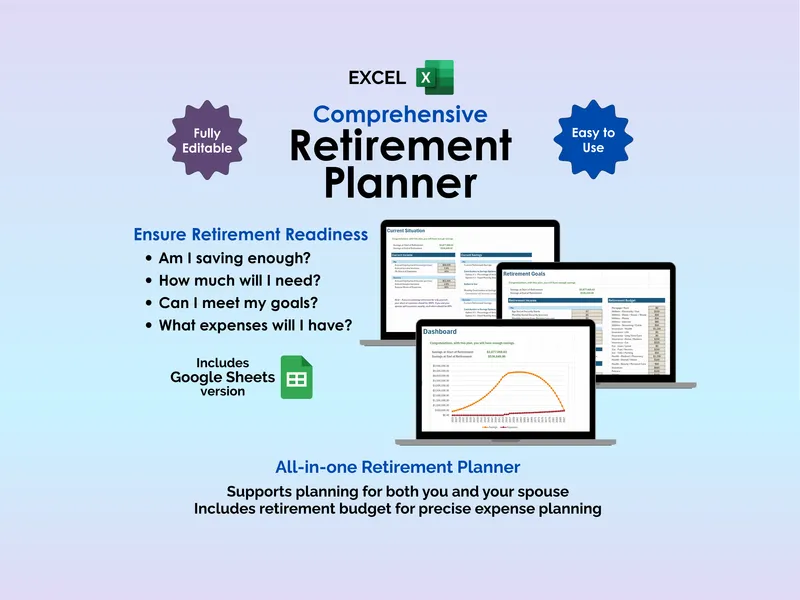
On the Current Situation sheet, you enter annual employment income, current retirement savings (think 401k and IRA balances), and your savings contribution. Two contribution options are built in: a percentage of current income, or a fixed monthly dollar amount. The sheet then applies your annual income increase and the inflation rate from Setup so contributions grow with your salary instead of staying frozen in today’s dollars.
The Retirement Goals sheet is where retirement income and spending take shape. You enter the age Social Security starts, monthly Social Security (with a separate field for a spouse), pension income, and any other gross monthly income. Retirement expenses use the same two-option pattern as contributions — a percentage of your inflation-adjusted current income, or a fixed monthly amount — and Social Security is automatically factored against expenses using a cost-of-living adjustment, so the comparison happens in future dollars, not today’s.
The Dashboard is the answer page. It shows savings at the start of retirement, savings at the end, and a year-by-year chart with your savings curve plotted against your expense line. Change any input on any sheet — a later retirement age, a Roth contribution bump, a more conservative return — and the chart redraws on the spot. The Detail tab then exposes every year of the underlying calculation in a single table: contributions, returns, withdrawals, expenses, and ending balance per year, so you can audit the math at any point on the timeline rather than trusting a black box.
What this retirement planning spreadsheet is, and what it isn’t: it’s a clean, deterministic projection you own outright, designed to answer the basic readiness question and let you stress-test it. There is no account, no subscription, and nothing about your inputs leaves your computer. If you’ve been carrying a vague sense that retirement is “probably fine,” this is the smallest reasonable step toward replacing that feeling with a number you can read.