Projects don’t fail from unknown risks. They fail from unranked ones. You probably already keep a list somewhere (a doc, a Slack thread, the back of your head), but a list isn’t a system. This google sheets risk register turns that scattered worry into a single ranked view where the biggest threats rise to the top automatically, so your weekly status update writes itself.
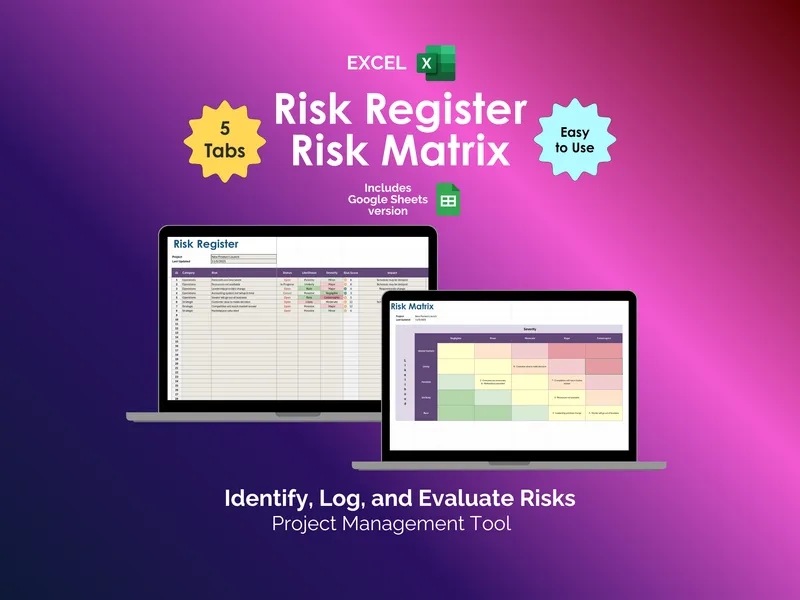
The frustration: you log a risk, assign a likelihood and a severity, and then forget which combination actually counts as “high.” The fix is a 5x5 Risk Matrix tab that auto-populates from your register, plotting every entry on a Likelihood by Severity grid (intense yellow through dark red) the second you fill a row. It’s the visual half of a proper risk matrix spreadsheet - the part stakeholders actually read.
The frustration: your register turns into a soup of inconsistent labels (“Ops,” “operations,” “OPERATIONS”) and the filters stop working by week three. The fix is a dedicated Configuration tab with two dropdown sources - Risk Category (Financial, Compliance, Legal, Operations, Reputation, Security, Strategic, Other) and Team Member - so every row in your google sheets risk register pulls from the same controlled vocabulary. Edit one list, the whole register updates.
The frustration: you have twenty-three open risks and no idea where the cluster is. The fix is an automated Dashboard tab that rebuilds three pie charts (Risk Status, Risk Likelihood, Risk Severity) and two bar charts (Risk Count by Category, Risk Count by Owner) every time you touch the register. No pivot tables to refresh, no chart ranges to extend - it’s the closest thing to a live risk dashboard you can build without a BI tool.
The frustration: you need ownership and accountability, but a name in a comment thread isn’t accountability. The fix is the Risk Register tab itself, with columns for ID, Category, Risk, Status, Likelihood, Severity, Risk Score, Impact, Mitigation, and Owner. Every threat gets a number, a person, and a plan (which is how PMBOK frames risk response in the first place), and the Risk Score column makes triage a sort-and-filter exercise instead of a debate.
What makes this risk matrix spreadsheet different from a free template you’d grab off a Google search: you get both the Google Sheets and Excel versions in the same purchase, so if your client opens it in Microsoft Excel and you live in Sheets, nobody has to convert anything. Five tabs (Register, Matrix, Configuration, Dashboard, and a setup guide), aligned with the PMBOK risk management process, and built to scale from a single product launch to a full strategic portfolio.
Open the sheet, paste your first ten risks, and you’ll have a ranked matrix and a dashboard before your next standup.