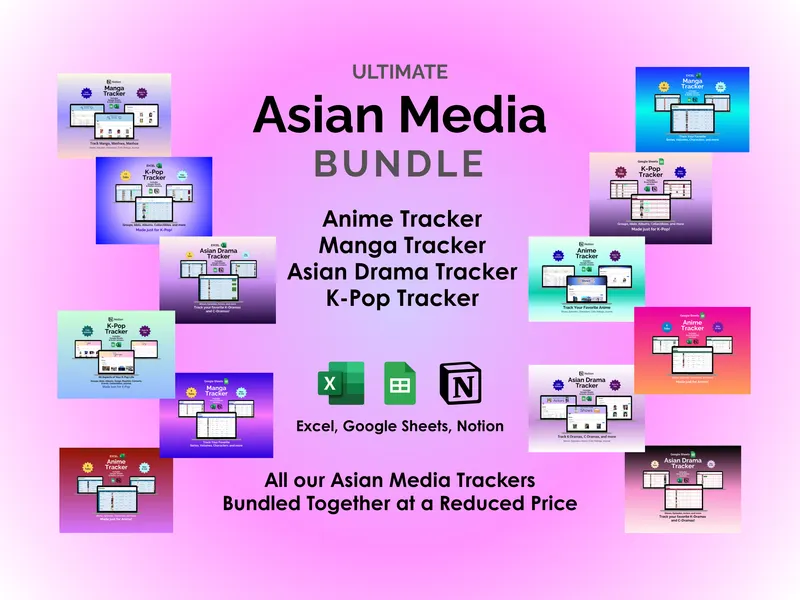
A kdrama tracker spreadsheet isn’t just a watchlist with prettier columns. It’s the thing that finally tells you which episode of Business Proposal you fell asleep during, which actor you keep seeing in everything, and whether the new C-Drama your friend swears by is actually rated well enough to be worth sixteen episodes of your weekend. This Google Sheets asian drama tracker organizes all of it across eight tabs, with separate Excel and Notion versions bundled in the same download.
It’s built for the K-Drama and C-Drama viewer whose Netflix “Continue Watching” row has quietly become a wall of half-finished mysteries. Every tab is a normal Google Sheet — no add-ons, no subscription, no scripts to enable. You open it in your browser, paste in a few show photos, and the kdrama tracker spreadsheet does the rest. Yes, we’re getting excited about a spreadsheet. Stay with us.
The Shows tab is the core. Each row logs one drama with its show photo, country, genre, sub-genre, year, season count, episode count, average episode duration, platform, and status. You also rate every series across five separate categories — Overall, Story, Acting, Production, and OST — which is the polite way of admitting that some dramas have a thin plot but an unfairly good soundtrack. Crash Landing on You, Extraordinary Attorney Woo, Alice in Borderland, When Life Gives You Tangerines — they all sit side by side with their own scores.
The Episodes tab goes one level deeper for the shows that deserve it. Log the show, show photo, episode number, episode title, episode photo, and an individual episode rating, so you can pinpoint exactly which installment of Hidden Love ruined you for the rest of the week. This is also where you stop guessing where you left off, which is the entire reason most people open a tracker in the first place.
The Actors tab handles the “wait, where do I know them from” problem. Each performer gets a photo, interest level (Interested, Very Interested, Favorite), birthplace, gender, birth date, current age, and the show you originally noticed them in. Spot a familiar face in a new drama, search the tab, and the connection is right there — no more mid-episode IMDb spirals.
The Critic Ratings tab lets you decide what’s worth starting before the opening credits hook you. Log the show, review site, review date, rating, max rating, percentage score, type of review, and a direct URL back to the source. Sites like IMDb, Rotten Tomatoes, MyDramaList, and Google all sit in the same table, and the sheet averages ratings across reviews so you’re comparing apples to apples instead of stars to tomatoes.
The Journal tab is the daily-viewing log: date, show, show photo, platform, minutes watched, episodes covered, and a notes column for anything from “OST slaps” to “why is everyone crying in the rain again.” Summary stats up top track your activity for the week and month, and a small progress chart plots your viewing over the past seven days.
The Dashboard pulls everything into one screen — total shows tracked, total episodes tracked, total actors tracked, total time spent watching, shows completed, shows currently watching, and number of critic ratings logged. Bar charts rank My Top Rated Shows next to Critic’s Top Rated Shows, a pie chart shows which titles have critic ratings versus which don’t, and a status chart breaks down what you’ve finished, paused, or dropped (no judgment).
What makes this tracker different from a generic watchlist app is granularity. Five rating categories per show, per-episode ratings, linked actor profiles, and critic ratings with source URLs all live in the same file you control — not behind someone else’s API. You can sort, filter, recolor, and add columns however you want, because it’s a Google Sheet, not a walled garden.
The download includes the Google Sheets, Excel, and Notion versions of the asian drama tracker, so you can pick whichever platform you already live in. Nothing to install, nothing to renew, and your viewing history stays in your own Drive.