
Margin is what's left, not what you sold
A print-on-demand sale has more between the price and your pocket than most sellers count. On an integrated listing (Etsy, Shopify with a print partner), four things come out before you keep anything:
- Base / print cost — what the print partner charges to make and hand off the item. The biggest number, and it climbs with product type, size, and print area.
- Fulfillment shipping — what the print partner charges you to ship. Offer “free shipping” and you're paying this out of the price, not escaping it.
- The platform's percentage — transaction, payment processing, and sometimes ads, blended into a cut of what the buyer pays.
- Flat per-order fees — the listing fee and the fixed part of payment processing. Small alone; they hit every order.
Margin = net profit ÷ what the buyer pays. If a $28 shirt nets you $7.64 after all of that, your margin is about 27%. The dollars are the profit; the percent lets you compare a $28 shirt against a $14 mug on equal footing.
The two ways a platform pays you
Every platform is one of two models, and telling them apart is the whole skill:
- Integrated (Etsy, Shopify): you set the price and pay the costs. Your net is sale price + shipping charged − base cost − fulfillment shipping − the platform's percentage − flat fees.
- Royalty (Amazon Merch, Redbubble, TeePublic): the platform owns the product and pays you a fixed royalty that is already net of its costs. There's nothing to subtract — the royalty is your margin.
That's why you can't compare a royalty's percent to an integrated listing's percent directly — a royalty reads as 100% margin because it's already net. Compare them on net dollars per sale instead.
The mug trap — where POD margin quietly collapses
Heavy or low-priced items, where shipping is a big share of the price, are where margins vanish. Illustrative figures for one design:
| Listing (illustrative) | Net profit / sale | Margin |
|---|---|---|
| $28 T-shirt (Etsy + Printful) | $7.64 | ~27% |
| $18 mug (Etsy + Printful) | $1.59 | ~9% |
| T-shirt (Amazon Merch royalty) | $5.35 | already net |
| Sticker (Redbubble royalty) | $1.30 | already net |
Same art, same shop — very different economics. The mug can be your most popular product and your least profitable at once. The fix isn't to drop it; it's to see the number, then raise the price, bundle it, or accept it as a loss-leader with eyes open. Figures are illustrative — base costs, fees, and royalties change often and vary by product and platform, so run your own.
You can net any single listing with the free POD Profit Calculator — no signup — to see the profit and margin without the arithmetic.
Why margin per design beats gross sales
Two designs can post identical gross sales while one nets three times the other, because one sells as high-margin shirts and the other as thin-margin mugs and stickers. Ranking your catalog by gross tells you what's popular; ranking it by net margin tells you what's paying you — and those are rarely the same list. Knowing which is which is how you decide what to make more of, and what to retire.
Related templates and concepts
POD margin is a specific case of profit margin. To decide when a workbook is enough and when a monthly analytics app earns its keep, read spreadsheet vs POD analytics tool, or browse every tool on the templates for print-on-demand sellers hub.
Templates that implement this
Tools that net your POD profit for you
3 templates
A connected workbook that nets your true profit per sale and per design across every product and platform — plus the wider operator tools behind a design-driven shop.
- $19.95 Spreadsheet
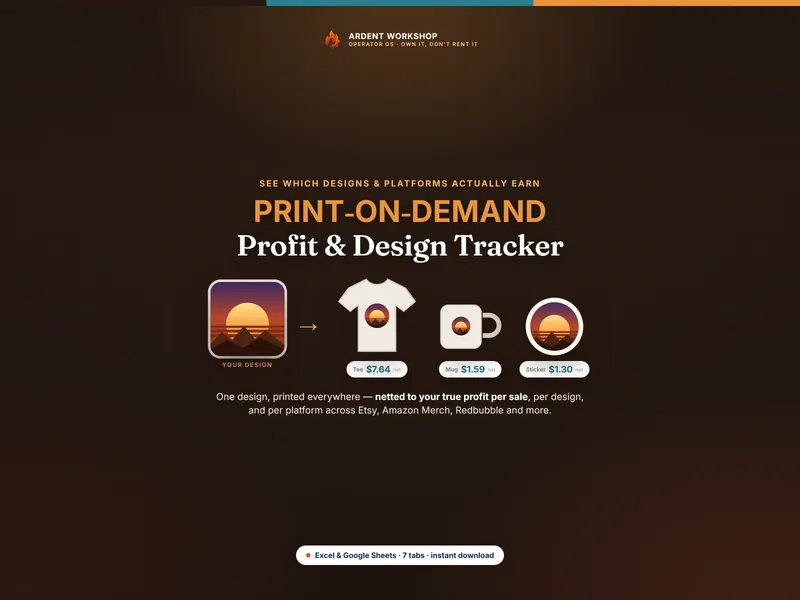
Print-on-Demand Profit & Design Tracker — POD Profit per Design, Platform Fees & Pricing for Etsy, Printful, Amazon Merch & Redbubble (Excel + Google Sheets)
A print-on-demand profit tracker for Excel & Google Sheets — net your profit per sale and per design across Etsy, Printful, Amazon Merch & Redbubble.
Operator OSView details - $24.95 Spreadsheet
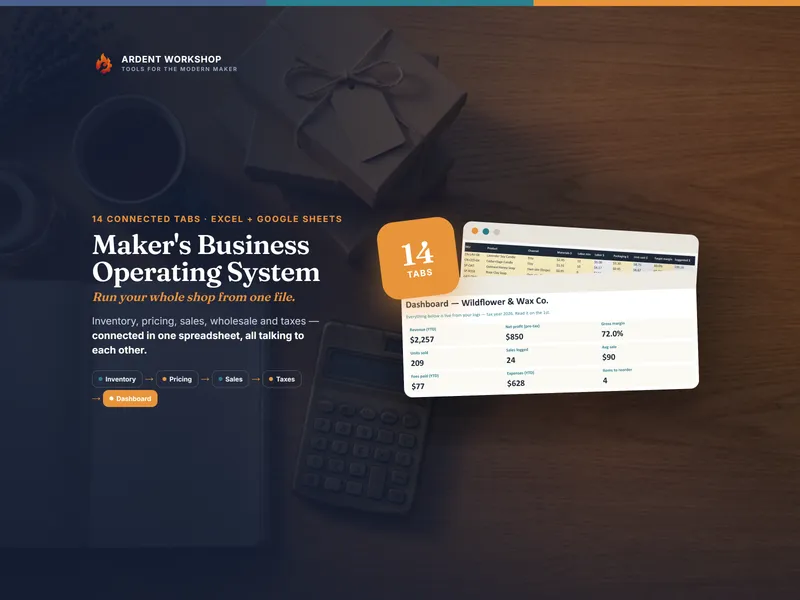
Maker's Business Operating System (Excel + Google Sheets)
One connected spreadsheet — Excel plus a ready-made Google Sheets copy — running your handmade business inventory, pricing, sales, wholesale and taxes.
Operator OSView details - $29.95 Spreadsheet

Photographer / Videographer Studio Ops Workbook — Package Pricing, Booking & Profit Calculator (Excel + Google Sheets)
Photography business workbook for Excel & Google Sheets — price packages from true cost, track bookings and balances, and see which shoots actually pay.
Operator OSView details